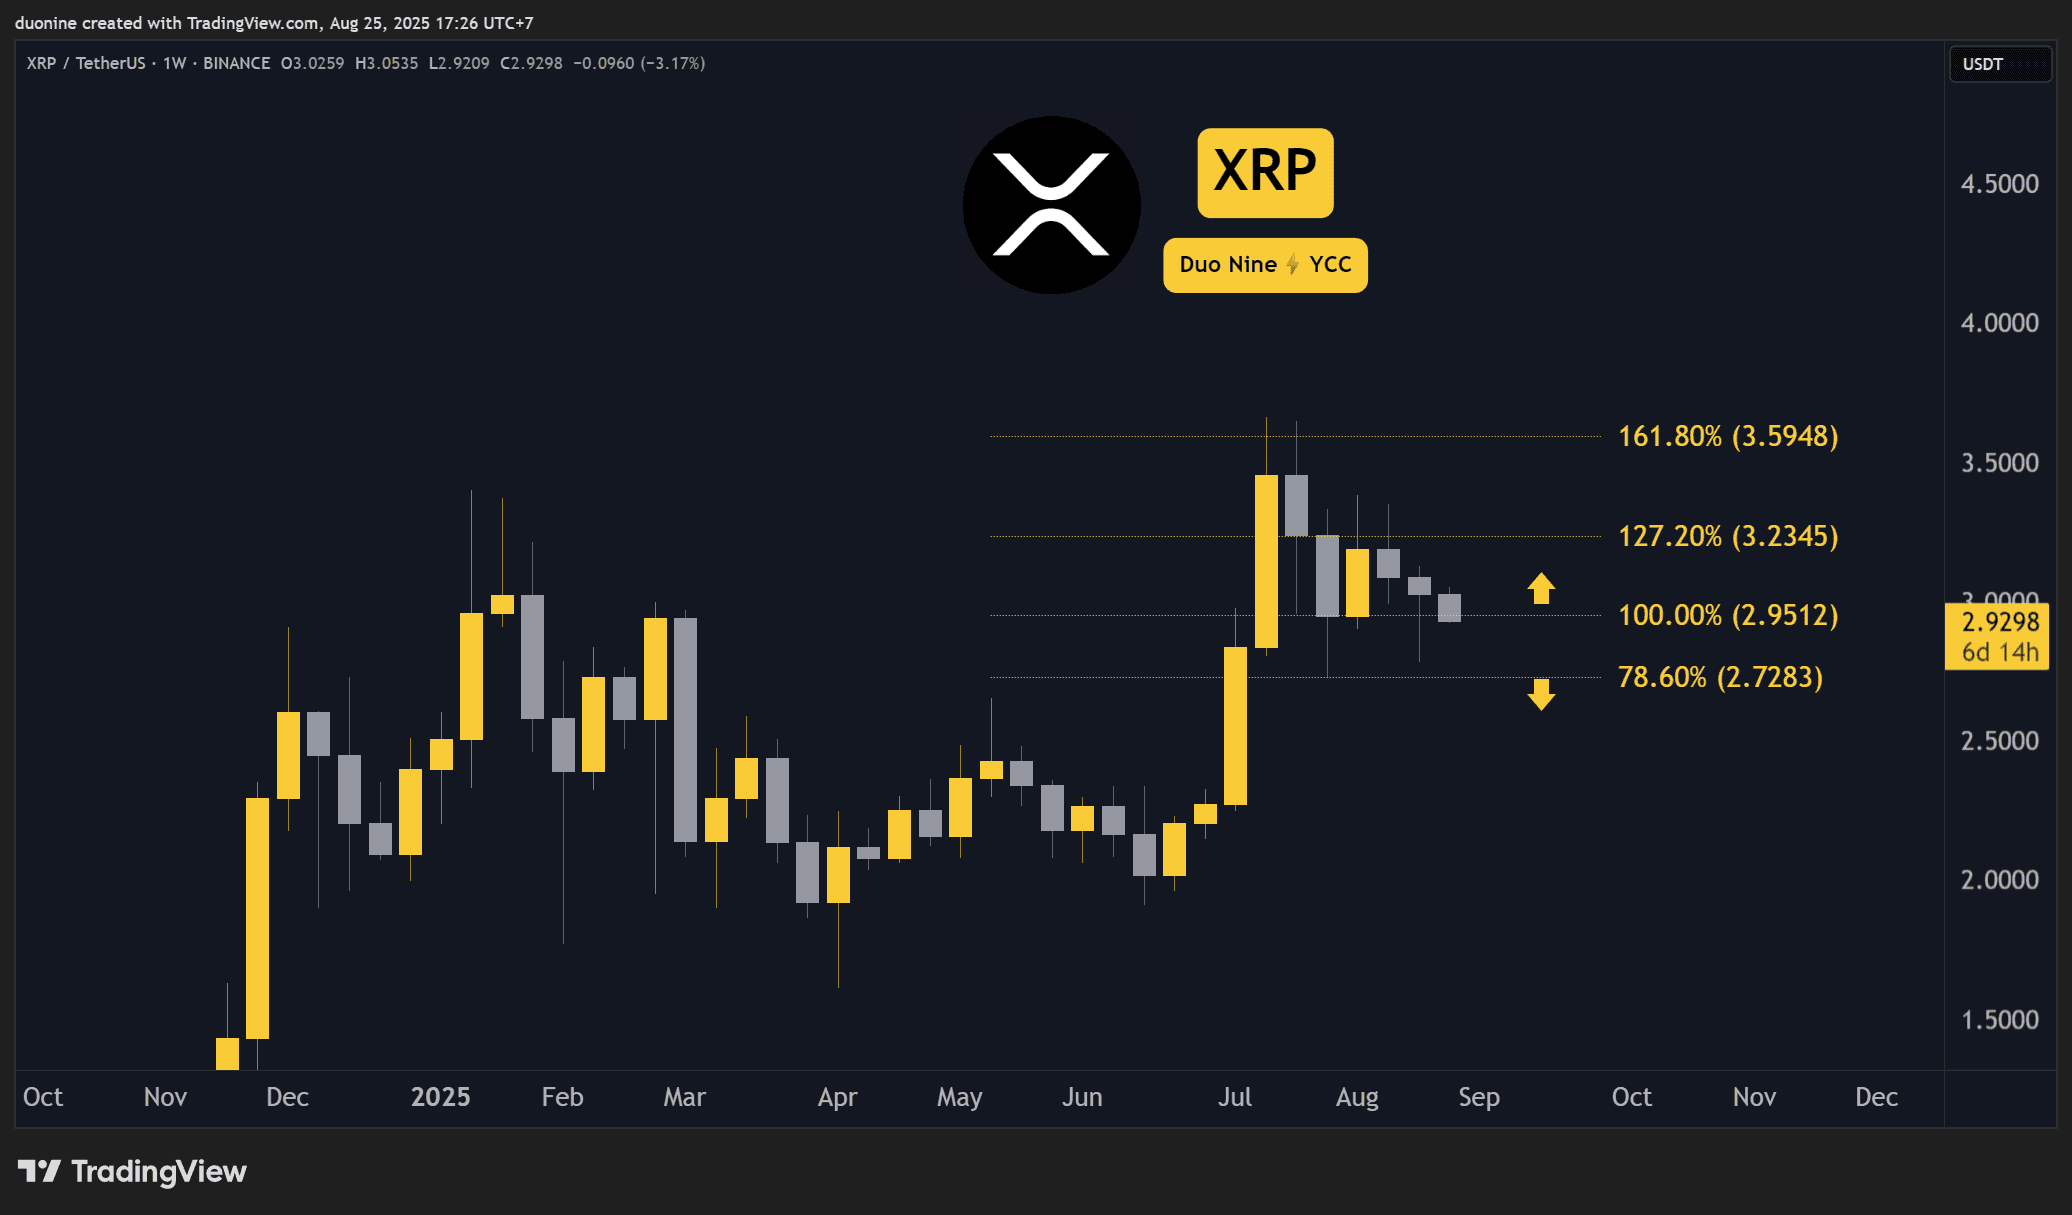
XRP price forecast is becoming increasingly bearish as the cryptocurrency failed to maintain its footing above the critical $3 mark. Traders and analysts are watching closely to see if support at $2.7 will prevent a deeper decline, or if downward momentum will persist through the week.
XRP price forecast is becoming increasingly bearish as the cryptocurrency failed to maintain its footing above the critical $3 mark. Traders and analysts are watching closely to see if support at $2.7 will prevent a deeper decline, or if downward momentum will persist through the week.
Support and Resistance Levels to Watch
The immediate line of defense for XRP currently rests at $2.7—a level that could prove vital in halting further losses. On the flip side, resistance levels remain firmly established at $3, followed by $3.6 and $4. A strong bounce from support could set the stage for a recovery rally, but short-term technical signals suggest sellers are in control.
Failed Attempt to Reclaim Key Support
Late last week, XRP made a run for the $3 level, briefly touching $3.1 before sellers pushed it back downward. By Monday, downward pressure had intensified, dragging the token below the $3 threshold once more. If bears successfully flip $3 into a resistance level, the next critical zone of interest lies at the $2.7 support.

Technical chart displays XRP’s failed recovery attempt above $3. Chart by TradingView.
Bearish Momentum Dominates Market Sentiment
XRP’s chart patterns are painting a cautionary tale. A series of lower highs are forming, and price action is now shaping a descending triangle pattern. This setup typically signals prolonged bearish momentum, with the base aligned at the $2.7 support. Should this level give way, further losses may follow as market confidence deteriorates.

A descending triangle pattern suggests continued selling pressure. Chart by TradingView.
MACD Confirms Downtrend
Adding weight to the bearish outlook, the MACD (Moving Average Convergence Divergence) on the 3-day chart has recently crossed into negative territory. This crossover typically indicates a shift in momentum from bullish to bearish. Additionally, both moving averages have declined more steeply in the past few days, reinforcing the overall downward trajectory.
Unless XRP can find solid footing at $2.7 and reverse course, the path of least resistance continues downward. Bulls will need significant buying pressure to reclaim control from aggressive sellers dominating current sentiment.

MACD crossover strengthens bearish outlook on the 3-day chart. Chart by TradingView.
Related: XRP Price: $12M Max Pain for Bears
For further updates, revisit the full article here and explore more crypto insights on CryptoPotato.
Quick Summary
XRP price forecast is becoming increasingly bearish as the cryptocurrency failed to maintain its footing above the critical $3 mark. Traders and analysts are watching closely to see if support at $2.7 will prevent a deeper decline, or if downward momentum will persist through the week.
Source
Information sourced from official Ripple publications, institutional research, regulatory documentation and reputable crypto news outlets.
Author
Ripple Van Winkle is a cryptocurrency analyst and founder of XRP Right Now. He has been active in the crypto space for over 8 years and has generated more than 25 million views across YouTube covering XRP daily.
Editorial Note
Opinions are the author's alone and for informational purposes only. This publication does not provide investment advice.


