XRP has shown strong bullish momentum, rebounding from the $2 level, driven by positive technical indicators and ETF inflows. Technical analysis suggests a potential rally towards $3.30–$3.50, contingent on breaking through key resistance levels.
What to Know:
- XRP has shown strong bullish momentum, rebounding from the $2 level, driven by positive technical indicators and ETF inflows.
- Technical analysis suggests a potential rally towards $3.30–$3.50, contingent on breaking through key resistance levels.
- A failure to overcome resistance at $2.23–$2.50 could lead to a bearish reversal, potentially driving the price back down to $1.82.
XRP is exhibiting signs of a robust recovery, bouncing back from the critical $2 mark. This resurgence is occurring against a backdrop of increasing institutional interest, as evidenced by the recent launch of XRP-backed ETFs. For institutional and high-net-worth investors, these technical and market structure developments signal a potential opportunity, albeit one that requires careful navigation.
The past week has seen XRP rally nearly 25% from the $2 psychological level. This move has been fueled, in part, by the launch of Grayscale’s GXRP and Franklin Templeton’s XRPZ, which have collectively attracted over $164 million in daily ETF inflows. The significance of these inflows cannot be overstated, as they represent a tangible increase in institutional demand and provide a solid foundation for further price appreciation. This mirrors the early days of Bitcoin ETFs, where substantial inflows often preceded significant price movements.
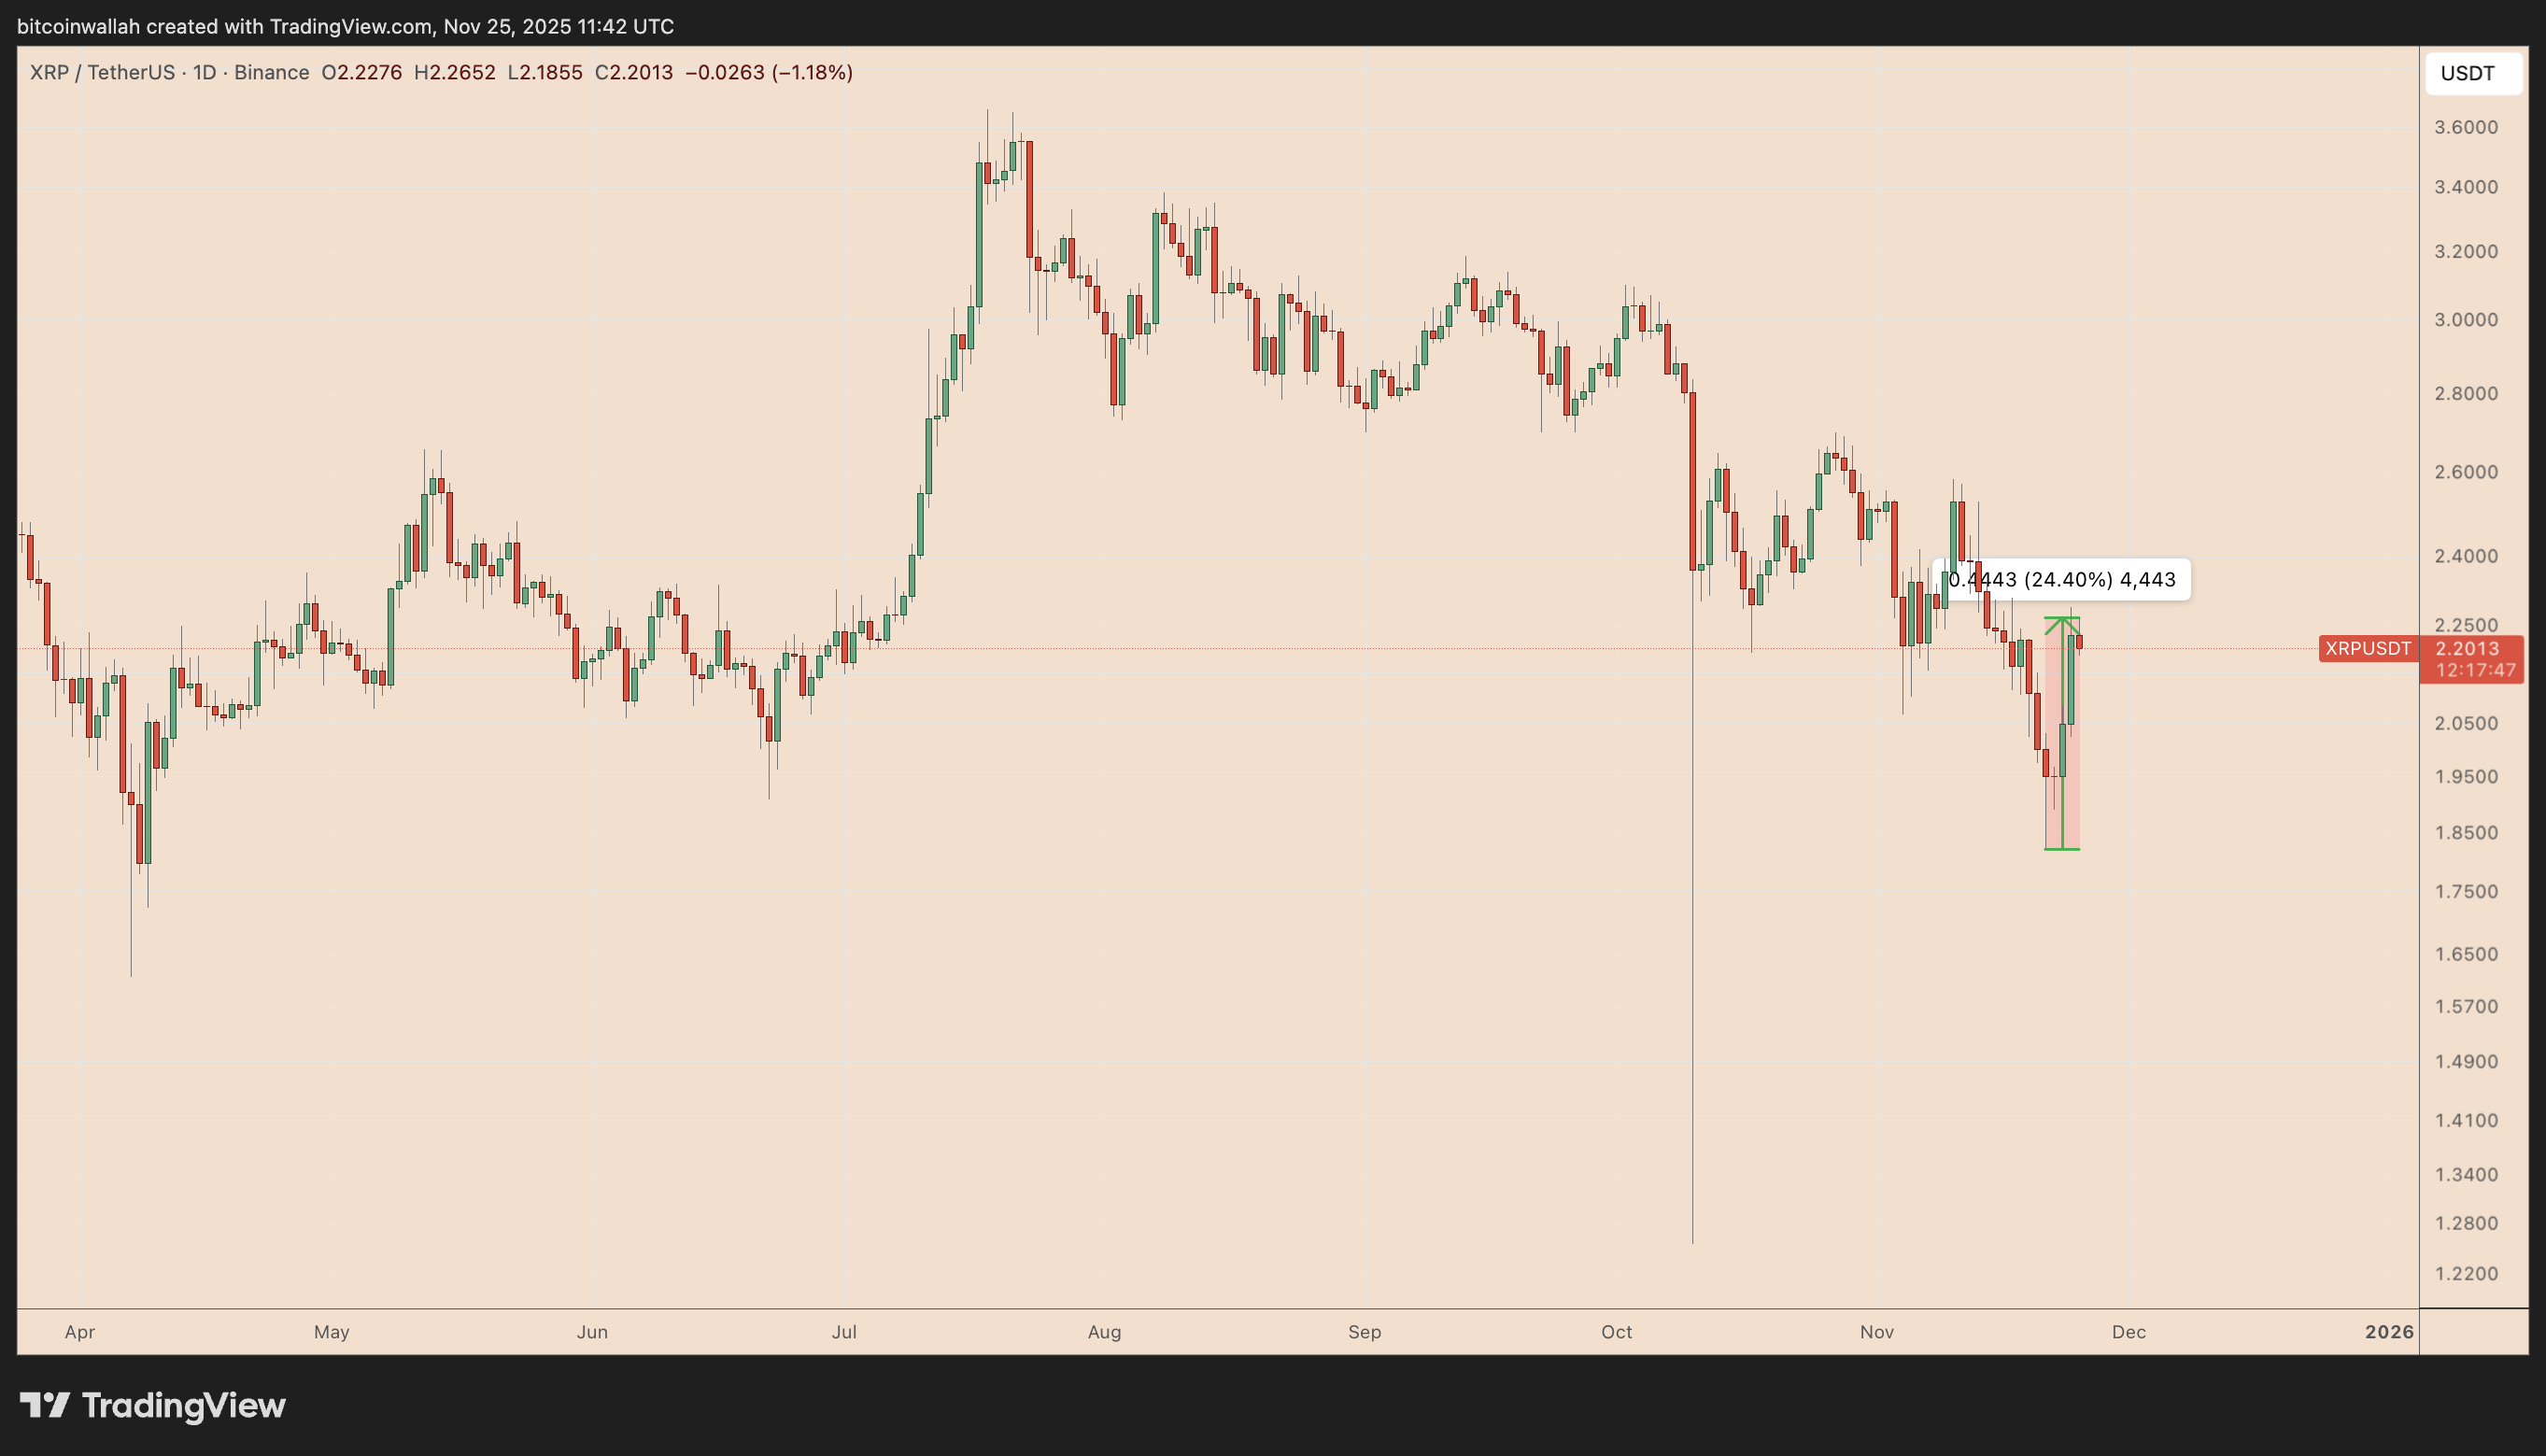
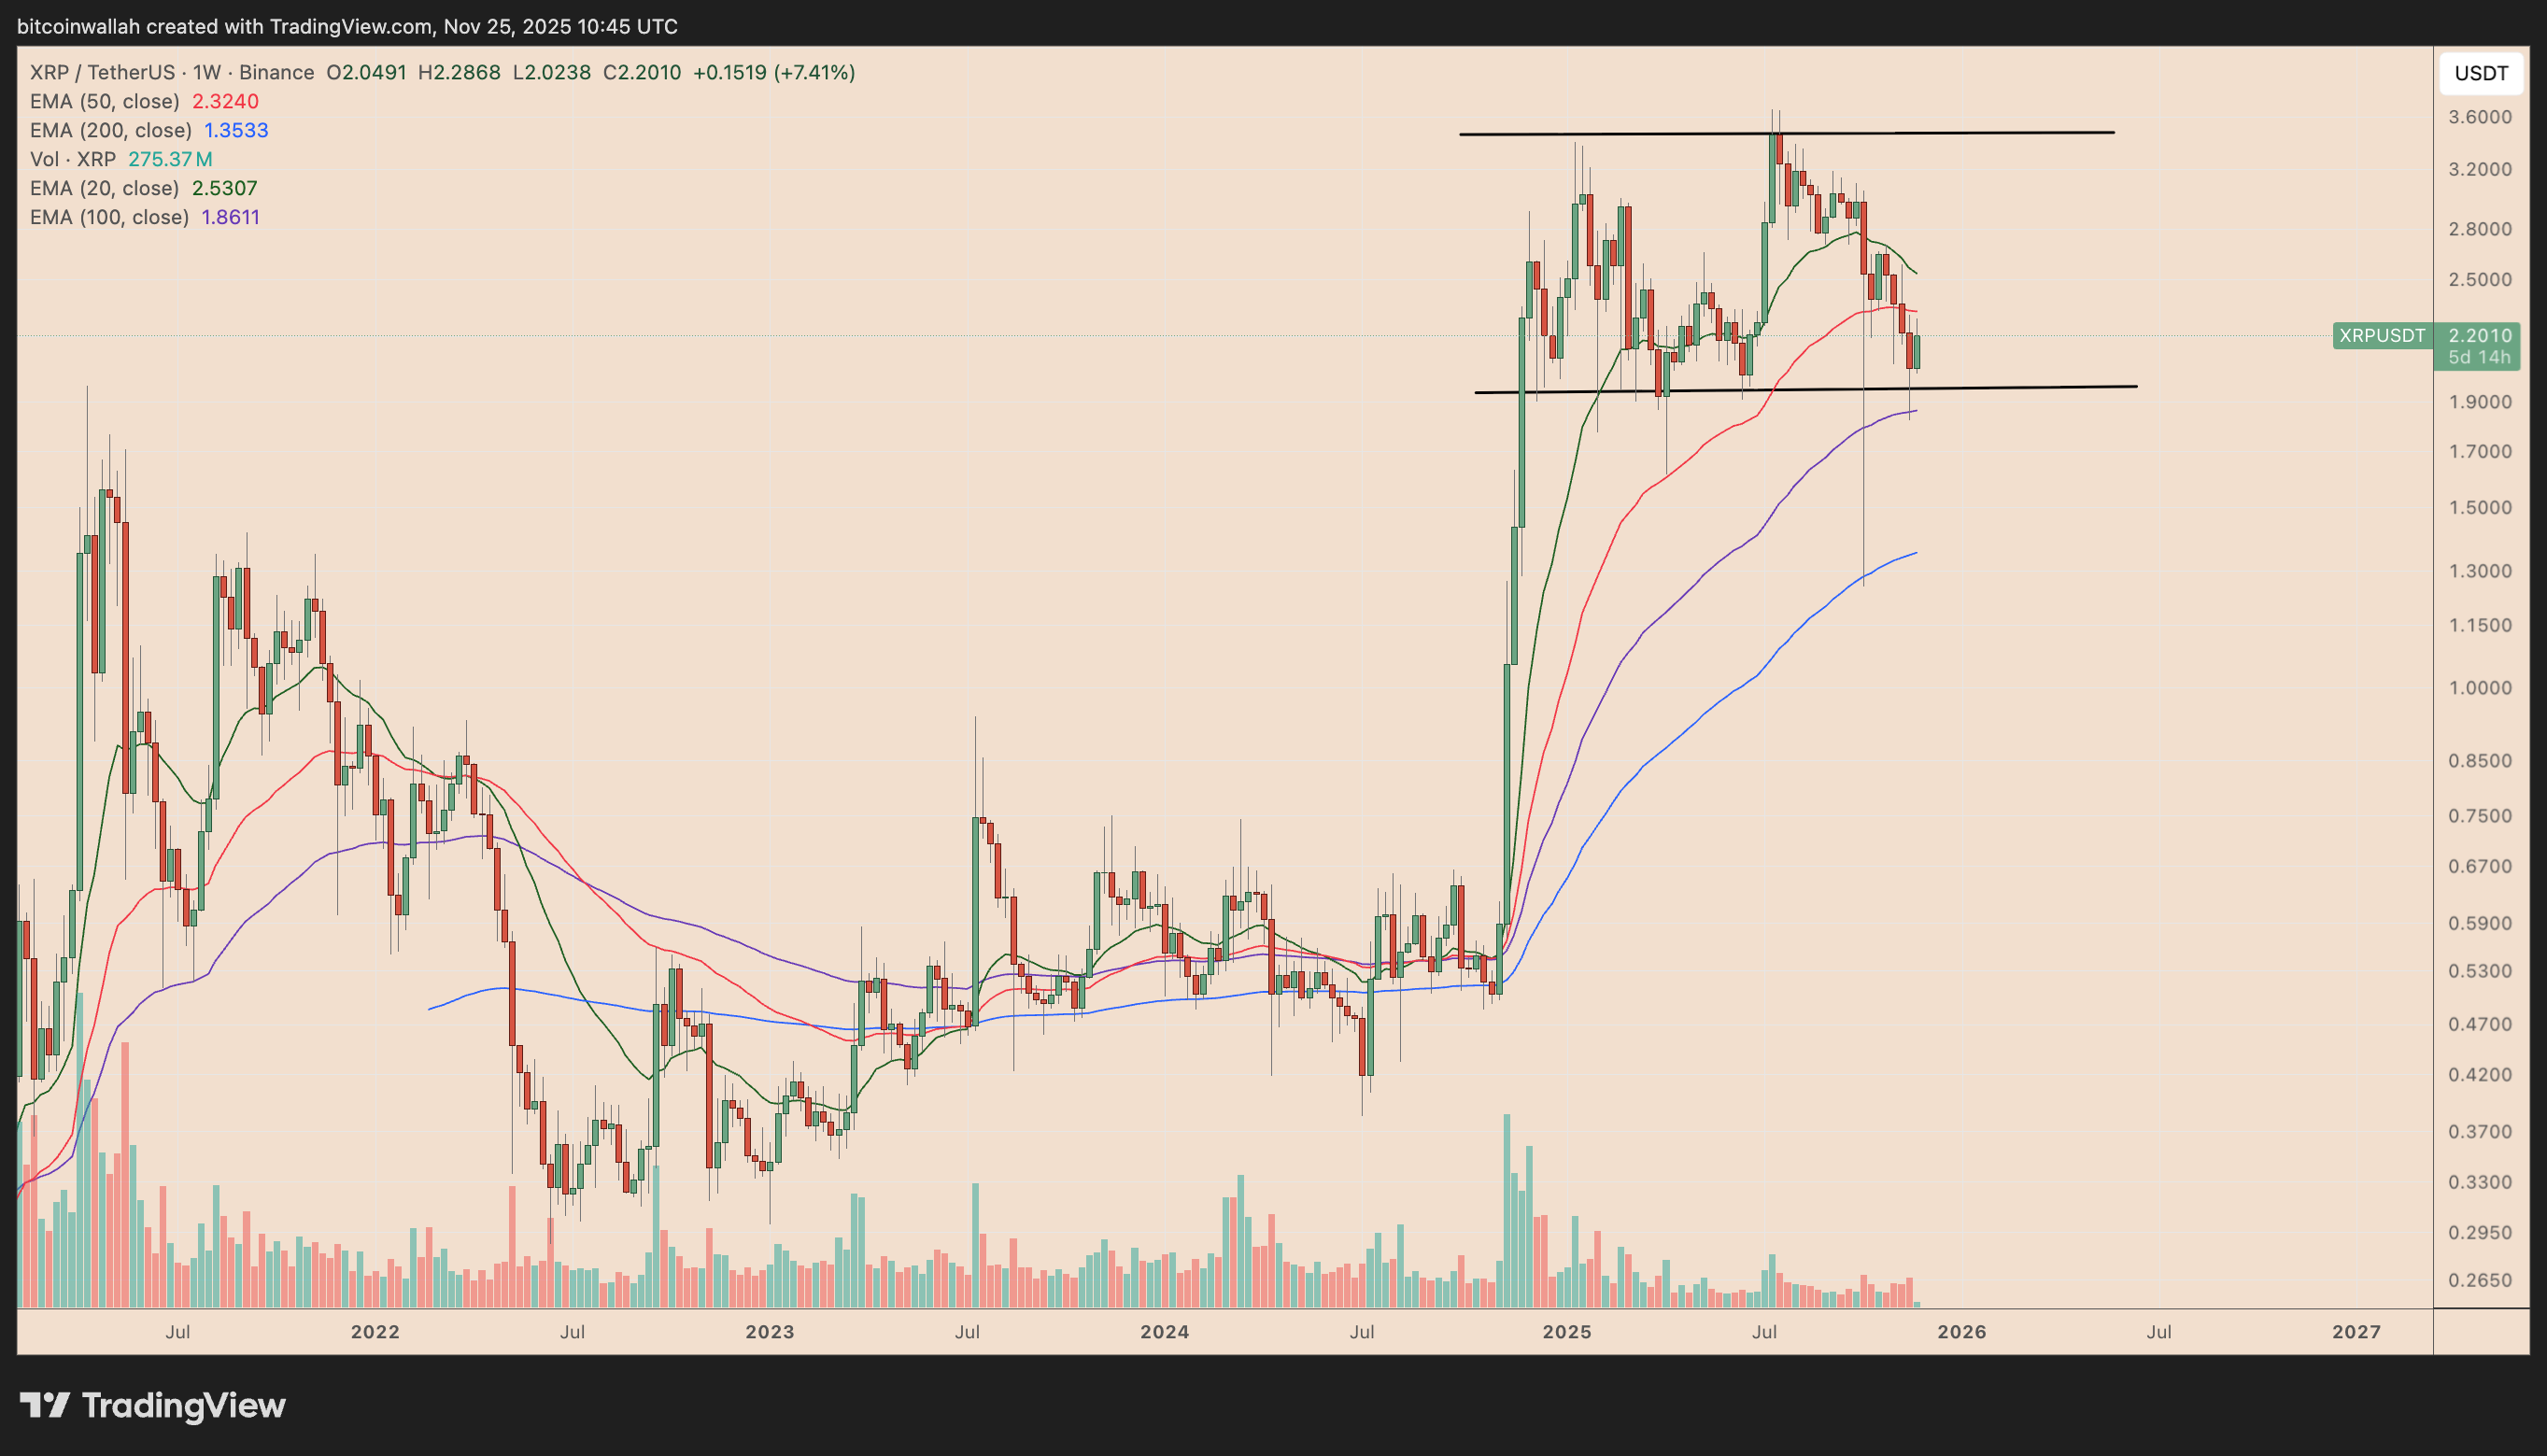
From a technical perspective, XRP’s ability to defend the $1.95–$2.05 support band is a bullish signal. This support level has been tested multiple times since December 2024, with each retest resulting in substantial bounces toward the $3.50 range. If this pattern holds, XRP could potentially gain another 50% by the end of the year. This kind of recurring pattern is what traders look for to confirm and build confidence in their positions.
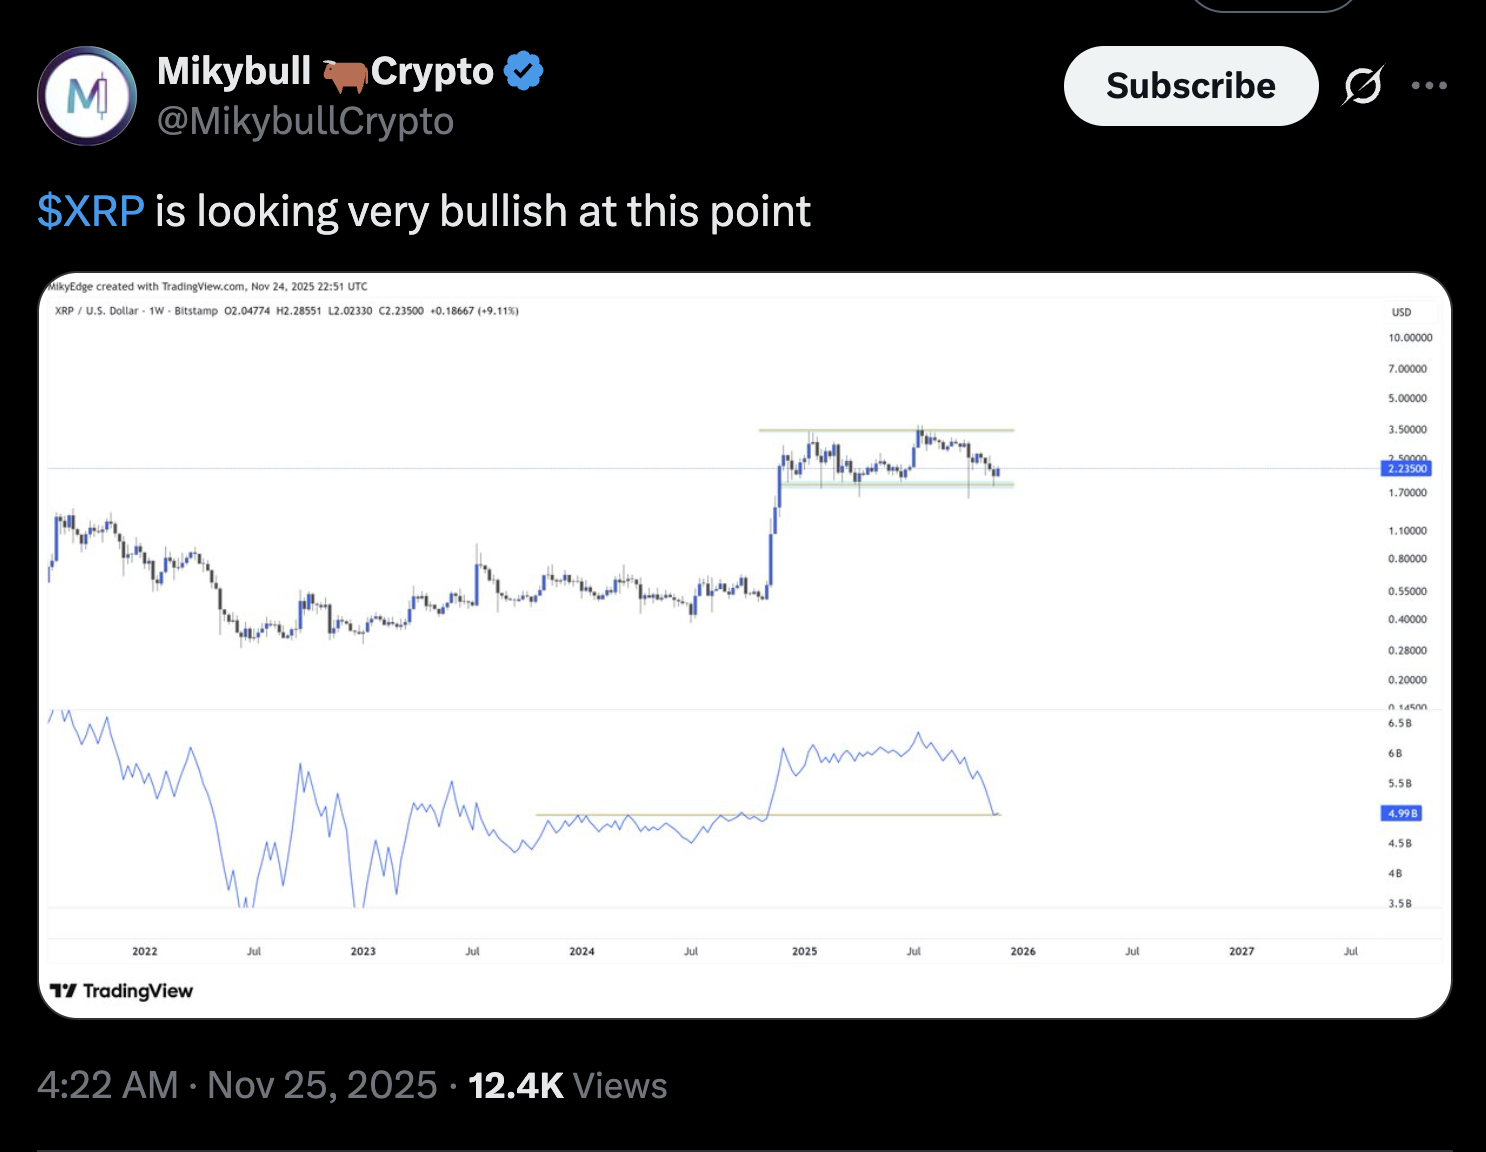
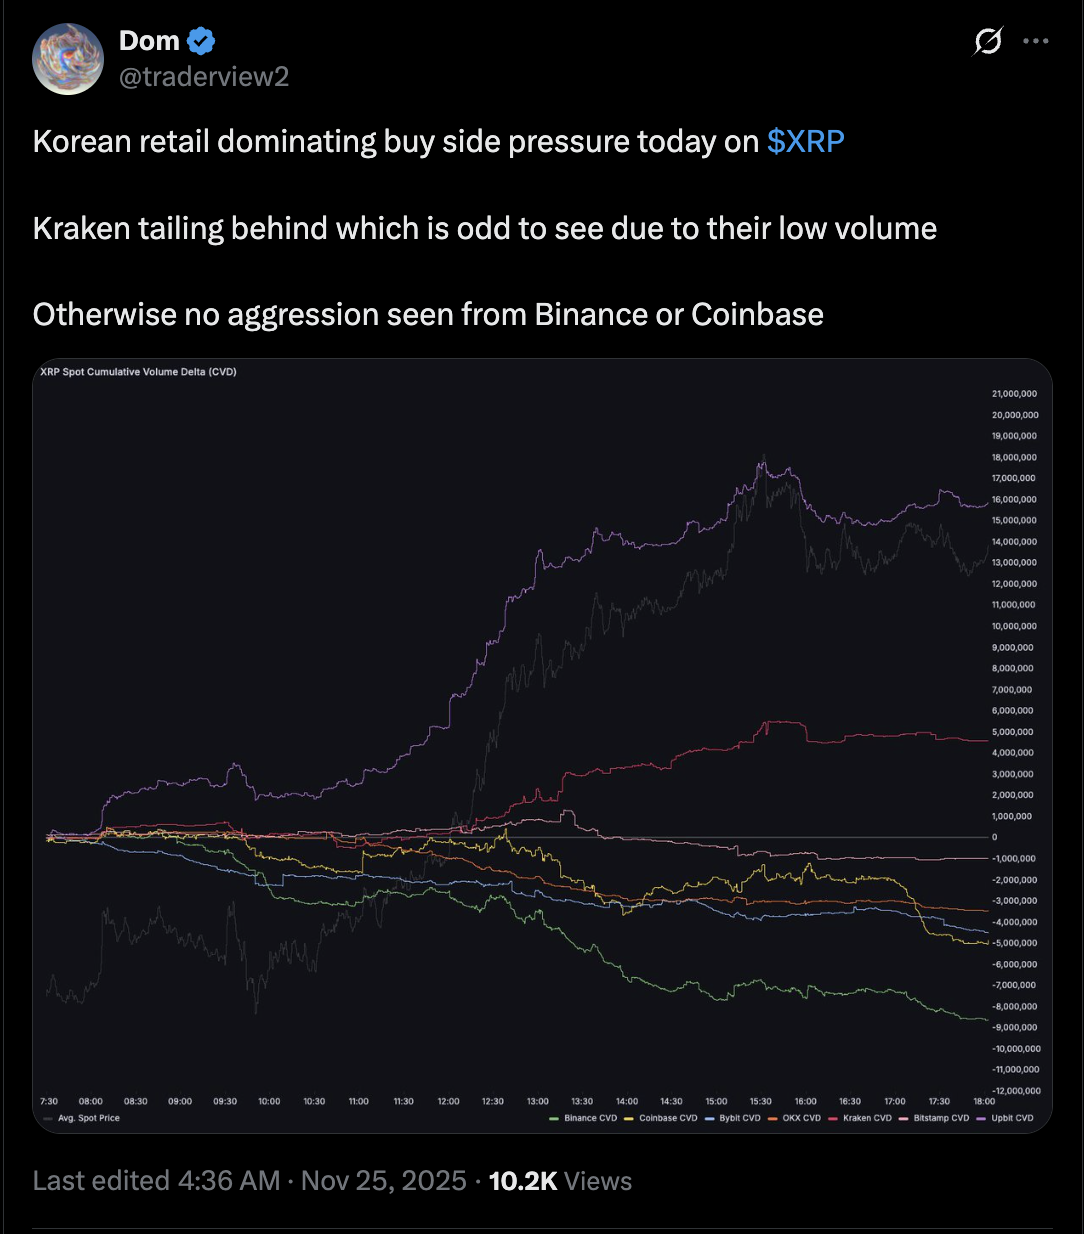
On-balance volume (OBV) is also providing a bullish narrative. OBV measures buying and selling pressure by looking at volume flow. The recent bounce in OBV from a major support area, coinciding with the price touching $2, suggests genuine buying interest. This indicates that spot buyers are stepping in, reinforcing the bullish outlook. This metric is particularly valuable as it helps distinguish between genuine accumulation and mere price fluctuations driven by derivatives or short-term speculation.
Drawing parallels to XRP’s 2017 breakout, some analysts suggest the current market structure mirrors the setup that preceded its historic rally. The $2 region is behaving similarly to the mid-range support reclaimed before that rally. With prices stabilizing and buyers returning, there is potential for XRP to revisit the $3.30–$3.50 range. Of course, past performance is never a guarantee, but these fractal patterns can offer clues to potential future movements.
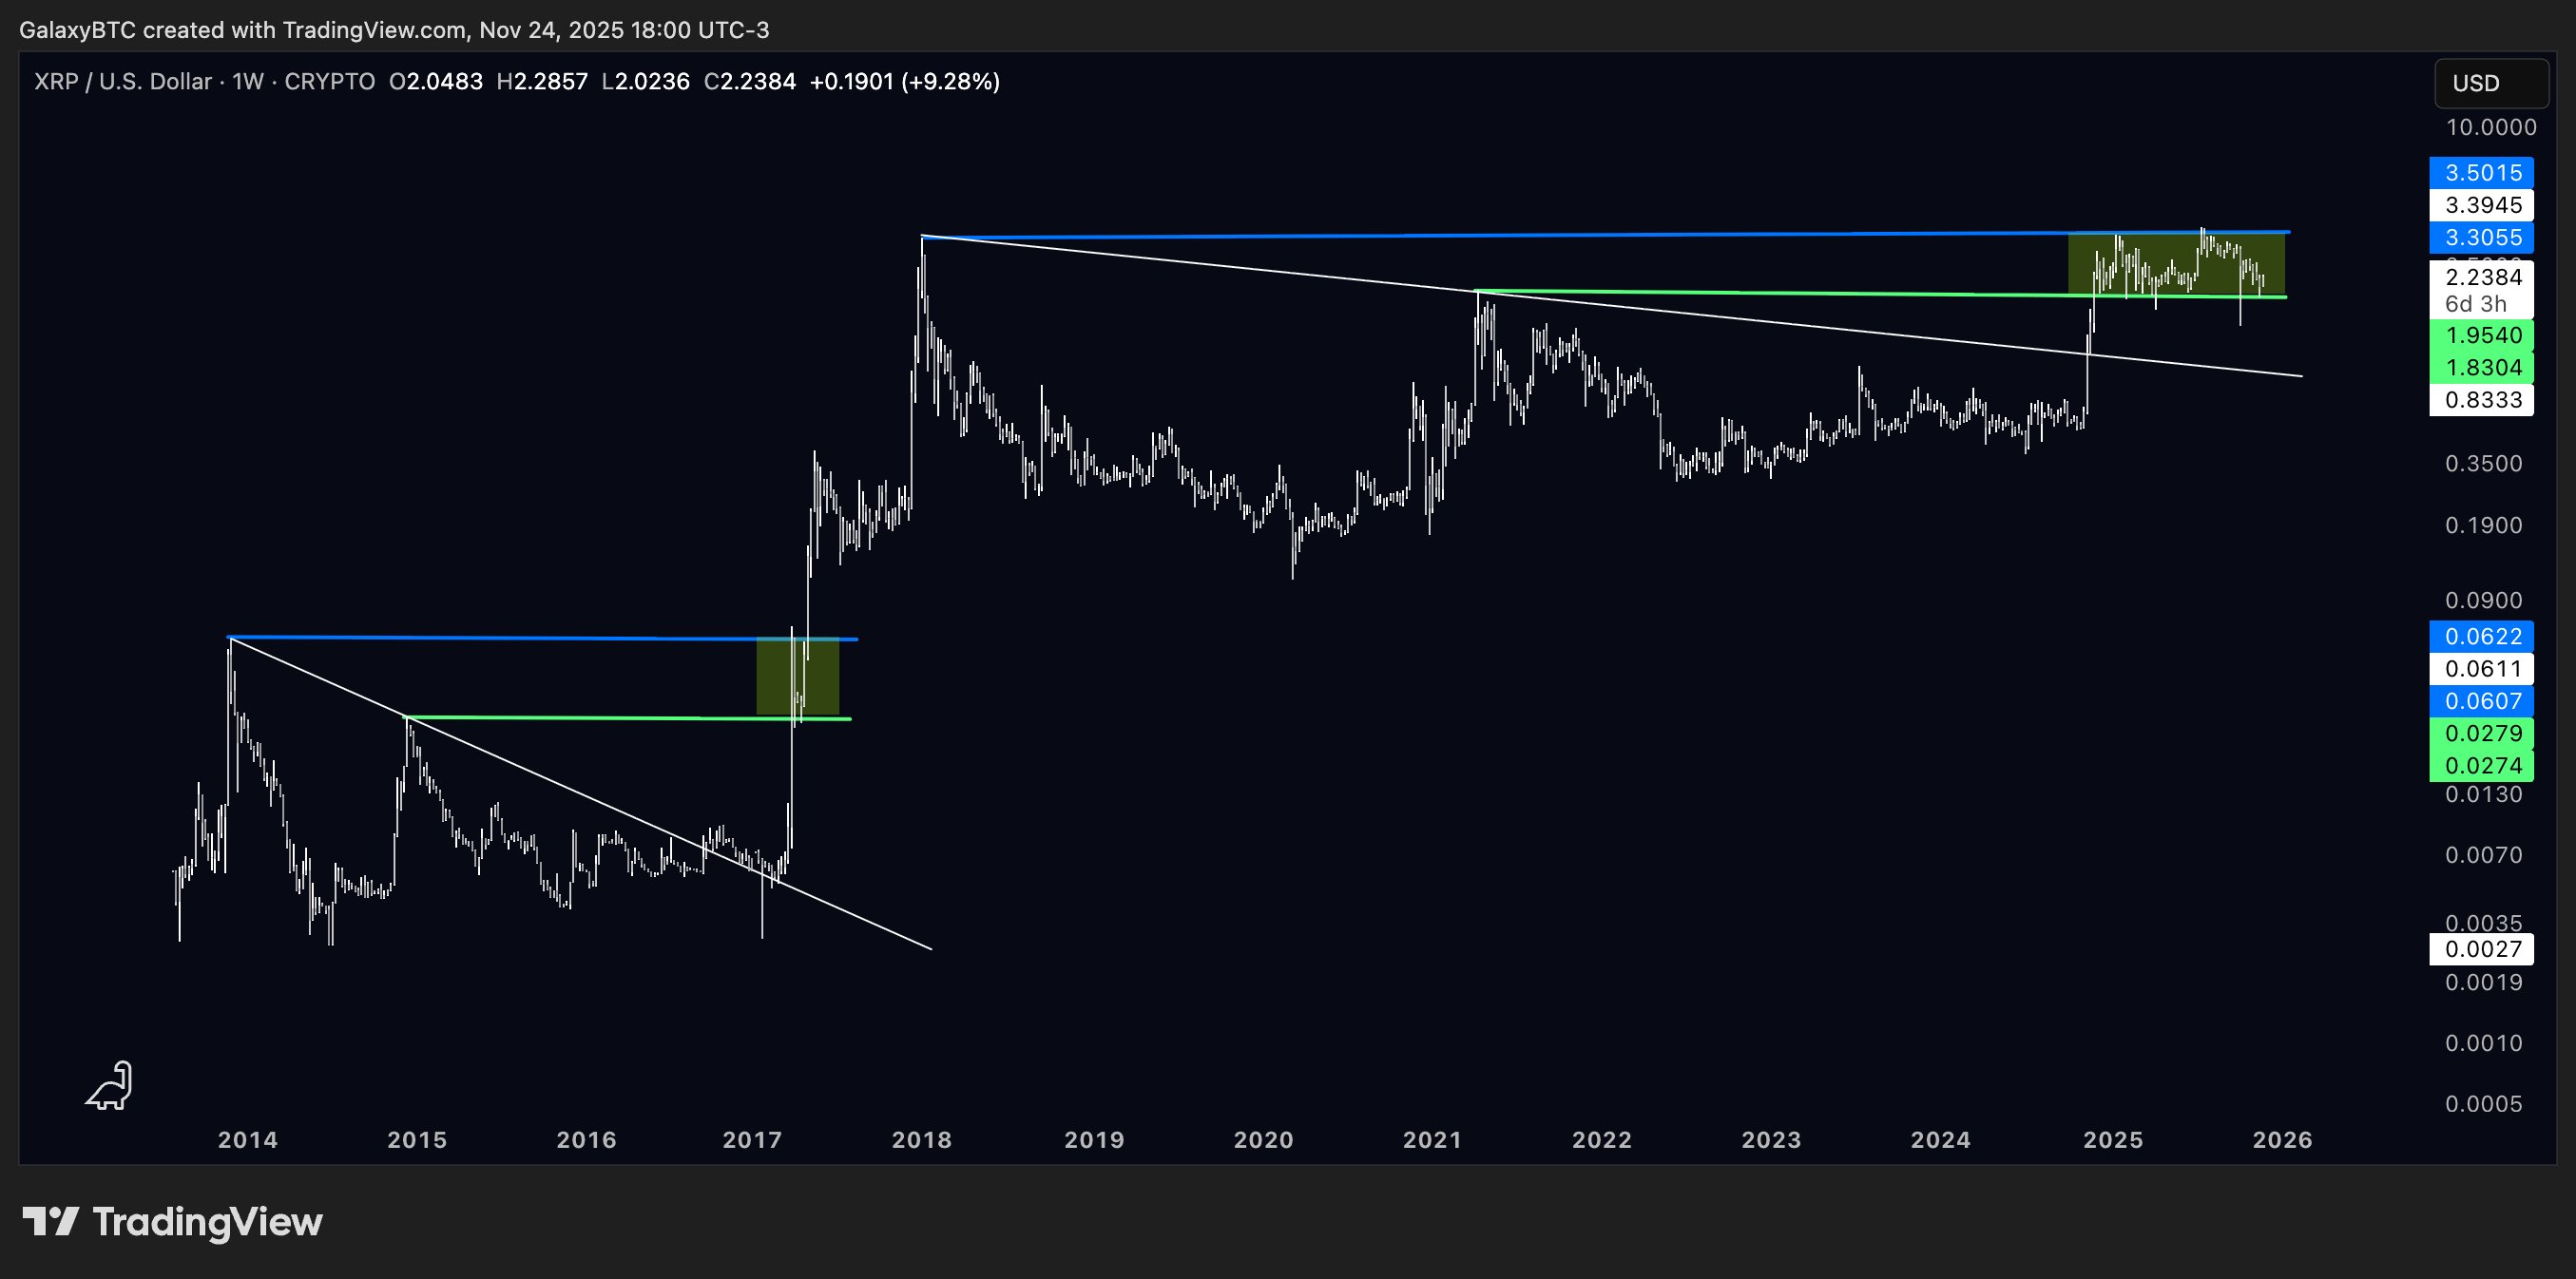
Despite the bullish signals, XRP faces significant technical hurdles. The token is currently testing the 0.236 Fibonacci retracement level near $2.23 as resistance. A decisive breakout above this level is crucial for confirming a sustained upside move. Further resistance lies at the 50-day and 200-day EMAs, which have previously capped XRP’s upward attempts. These moving averages coincide with the upper trendline of XRP’s descending channel, a pattern that has guided the price lower since the summer.

If XRP fails to break above these resistance levels, the price could rotate back to the channel’s lower boundary, potentially dropping toward the 0.0 Fib line near $1.82 by year-end. Such a move would weaken the bullish setup, suggesting the recent bounce was merely a temporary correction. Prudent investors should be prepared for either scenario, with clearly defined risk management strategies in place.
In summary, XRP’s recent performance presents a mixed bag of bullish indicators and potential resistance. The combination of strong ETF inflows, positive technical signals, and historical parallels suggests a possible rally toward $3.30–$3.50. However, the path is not without its challenges, and a failure to overcome key resistance levels could lead to a significant correction. As always, investors should conduct thorough due diligence and consider their risk tolerance before making any investment decisions.
Related: XRP Price: $12M Max Pain for Bears
Source: Original article
Quick Summary
XRP has shown strong bullish momentum, rebounding from the $2 level, driven by positive technical indicators and ETF inflows. Technical analysis suggests a potential rally towards $3.30–$3.50, contingent on breaking through key resistance levels.
Source
Information sourced from official Ripple publications, institutional research, regulatory documentation and reputable crypto news outlets.
Author
Ripple Van Winkle is a cryptocurrency analyst and founder of XRP Right Now. He has been active in the crypto space for over 8 years and has generated more than 25 million views across YouTube covering XRP daily.
Editorial Note
Opinions are the author's alone and for informational purposes only. This publication does not provide investment advice.


