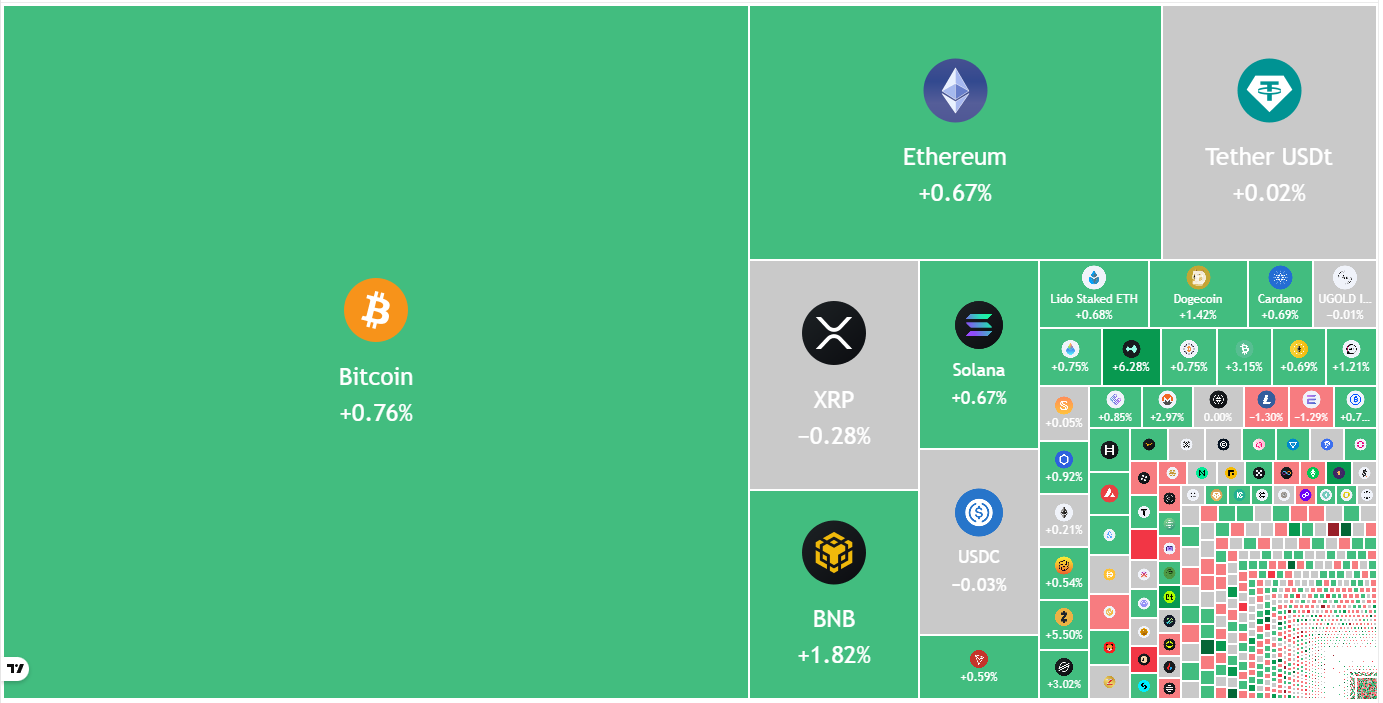
Bitcoin’s recovery faces resistance around $89,000, with potential to test $93,500 if bullish momentum sustains. Ethereum is encountering selling pressure near $3,000, but resilience suggests a possible move toward its 20-day EMA at $3,120.
What to Know:
- Bitcoin’s recovery faces resistance around $89,000, with potential to test $93,500 if bullish momentum sustains.
- Ethereum is encountering selling pressure near $3,000, but resilience suggests a possible move toward its 20-day EMA at $3,120.
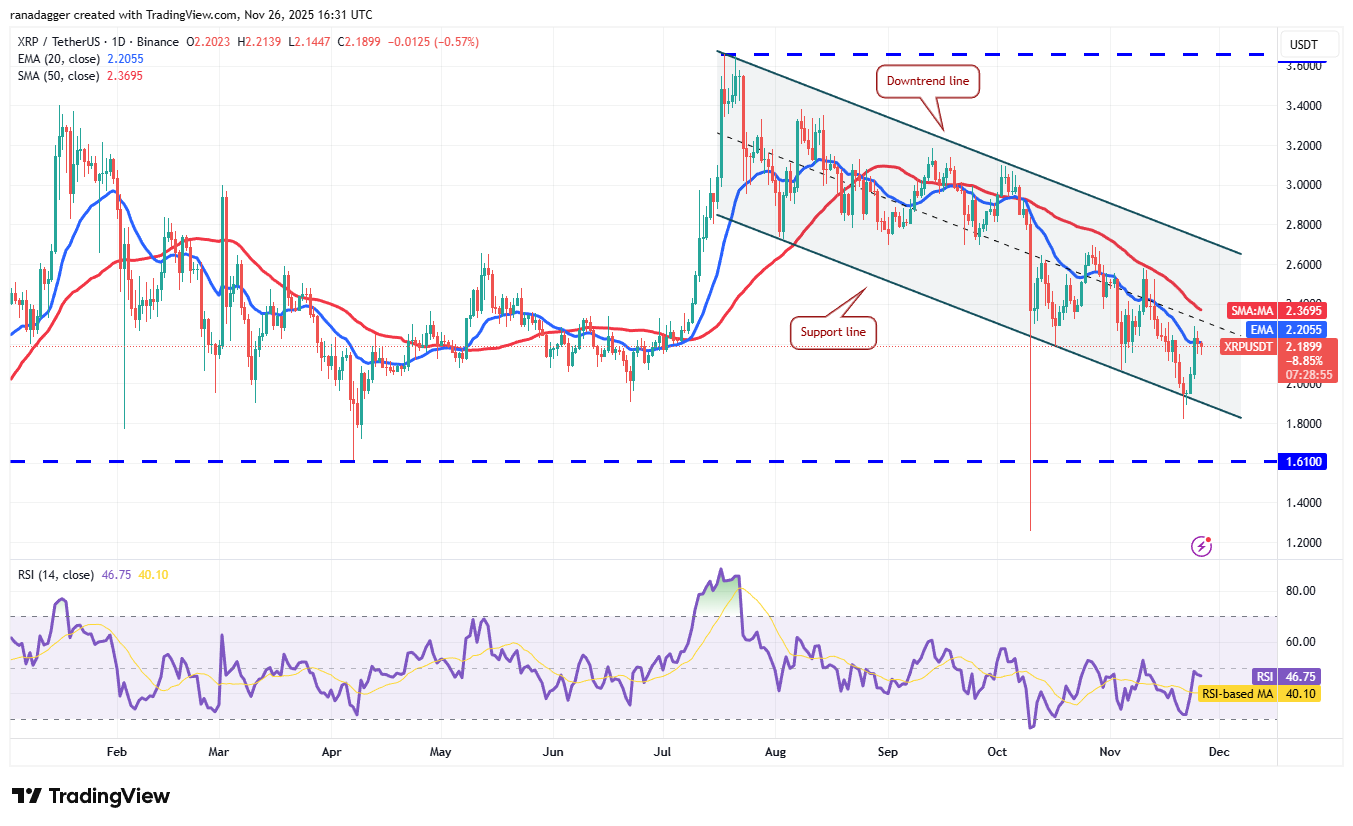
- XRP is contending with resistance at its 20-day EMA ($2.20); a breakthrough could signal continued range-bound trading within its descending channel.
Bitcoin and several altcoins are attempting to rebound, yet these assets are likely to encounter substantial selling pressure as they approach higher price levels. The question remains whether Bitcoin can reach $100,000 amidst current market dynamics. This analysis delves into the critical price levels for Bitcoin and other major altcoins, providing insights for institutional investors and active traders navigating this volatile market.

Bitcoin’s recovery is showing signs of fatigue as bears try to keep the price below $88,000. Market analysts have differing views, with some suggesting the current rally is merely a “dead cat bounce,” while others point to AI-driven predictions indicating a limited chance of Bitcoin falling below $84,500 by year-end. However, the same models suggest less than a 50% probability of reclaiming $100,000 by December 31. These varying perspectives underscore the inherent uncertainty in forecasting crypto asset prices, reminiscent of the challenges faced in traditional equity markets during periods of high volatility.
Looking at specific price levels, Bitcoin’s recovery is expected to face resistance at the 20-day exponential moving average (EMA) around $93,431. A failure to breach this level could signal continued negative sentiment, potentially leading to a retest of the $80,600 support. Should this support fail, a further decline to $73,777 is possible. Conversely, a break above the 20-day EMA could pave the way for a rally toward the psychological $100,000 mark. Institutional investors should closely monitor these levels as potential entry or exit points, adjusting their strategies based on confirmed breakouts or breakdowns.

Ethereum’s recovery is meeting resistance near $3,000, but the bulls’ ability to hold ground suggests potential for further gains. The next target is the 20-day EMA at $3,120, followed by the $3,350 breakdown level. A rejection at this overhead resistance could see bears pushing the price below $2,623, potentially leading to a collapse toward $2,400. To negate this bearish scenario, buyers need to sustain the price above the 50-day simple moving average (SMA) at $3,596, signaling a possible end to the downtrend. The dynamics here mirror those seen in traditional asset classes, where key moving averages often act as significant support and resistance levels.
XRP is currently facing selling pressure at its 20-day EMA of $2.20, but sustained buying interest is evident. A close above this EMA could allow XRP to remain within its descending channel pattern. A break above the downtrend line would signal a potential trend change. Conversely, a sharp decline from the 20-day EMA could see bears attempting to push the price below the support line, potentially leading to a fall to $1.61. For institutional portfolios, these levels provide critical risk-management benchmarks.

BNB is experiencing a tug-of-war between buyers and sellers around the $860 breakdown level. A decline from the current level or the 20-day EMA ($911) would indicate continued selling pressure, increasing the risk of a break below $790 and a potential drop to $730. However, if BNB breaks above the 20-day EMA, it would suggest a rejection of the breakdown below $860, potentially leading to a rally toward the 50-day SMA at $1,034.
Solana is encountering resistance near its 20-day EMA ($144), suggesting bears are active at these levels. Sellers will likely try to push the price below the $126 support, and a successful breach could send the SOL/USDT pair toward $110 and then $95. Buyers are expected to defend the $95 support vigorously. To gain the upper hand, bulls need to overcome the 20-day EMA, which could then lead to a rally toward the 50-day SMA ($170).
Dogecoin’s bounce from $0.14 is facing resistance at the 20-day EMA ($0.16), indicating that bears are trying to maintain control. A sharp rejection from this EMA increases the risk of breaking below $0.14, potentially sending Dogecoin toward the October 10 low of $0.10. Conversely, a break above the 20-day EMA suggests weakening bearish control, potentially leading to a rally toward the 50-day SMA ($0.18).
Cardano’s shallow bounce from $0.38 indicates a lack of strong buying interest. Bears will aim to resume the downtrend by pushing the price below $0.38, potentially leading to a collapse toward the October 10 low of $0.27. Buyers face an uphill battle, with any recovery attempt likely meeting resistance at the $0.50 breakdown level.
In summary, while select cryptocurrencies show signs of recovery, significant resistance levels loom. Bitcoin’s ability to overcome the $93,500 hurdle will be crucial in determining its next move toward $100,000, while Ethereum needs to breach its 50-day SMA to confirm a trend reversal. XRP’s performance relative to its 20-day EMA will dictate its short-term trajectory. These technical levels offer valuable insights for institutional investors managing risk and seeking opportunities in the digital asset space.
Related: Cardano Bull Setup Points to December Rally
Source: Original article
Quick Summary
Bitcoin’s recovery faces resistance around $89,000, with potential to test $93,500 if bullish momentum sustains. Ethereum is encountering selling pressure near $3,000, but resilience suggests a possible move toward its 20-day EMA at $3,120.
Source
Information sourced from official Ripple publications, institutional research, regulatory documentation and reputable crypto news outlets.
Author
Ripple Van Winkle is a cryptocurrency analyst and founder of XRP Right Now. He has been active in the crypto space for over 8 years and has generated more than 25 million views across YouTube covering XRP daily.
Editorial Note
Opinions are the author's alone and for informational purposes only. This publication does not provide investment advice.


