XRP is displaying surprising resilience amid a broader pullback in the cryptocurrency market, as Bitcoin and Ether both lose upward momentum following recent macroeconomic cues.
XRP is displaying surprising resilience amid a broader pullback in the cryptocurrency market, as Bitcoin and Ether both lose upward momentum following recent macroeconomic cues.
Bitcoin Fails to Sustain Gains Post-Powell
Bitcoin (BTC) has dropped back to levels seen before Federal Reserve Chair Jerome Powell’s speech last Friday, which initially boosted investor confidence with dovish commentary that hinted at potential interest rate cuts in September.
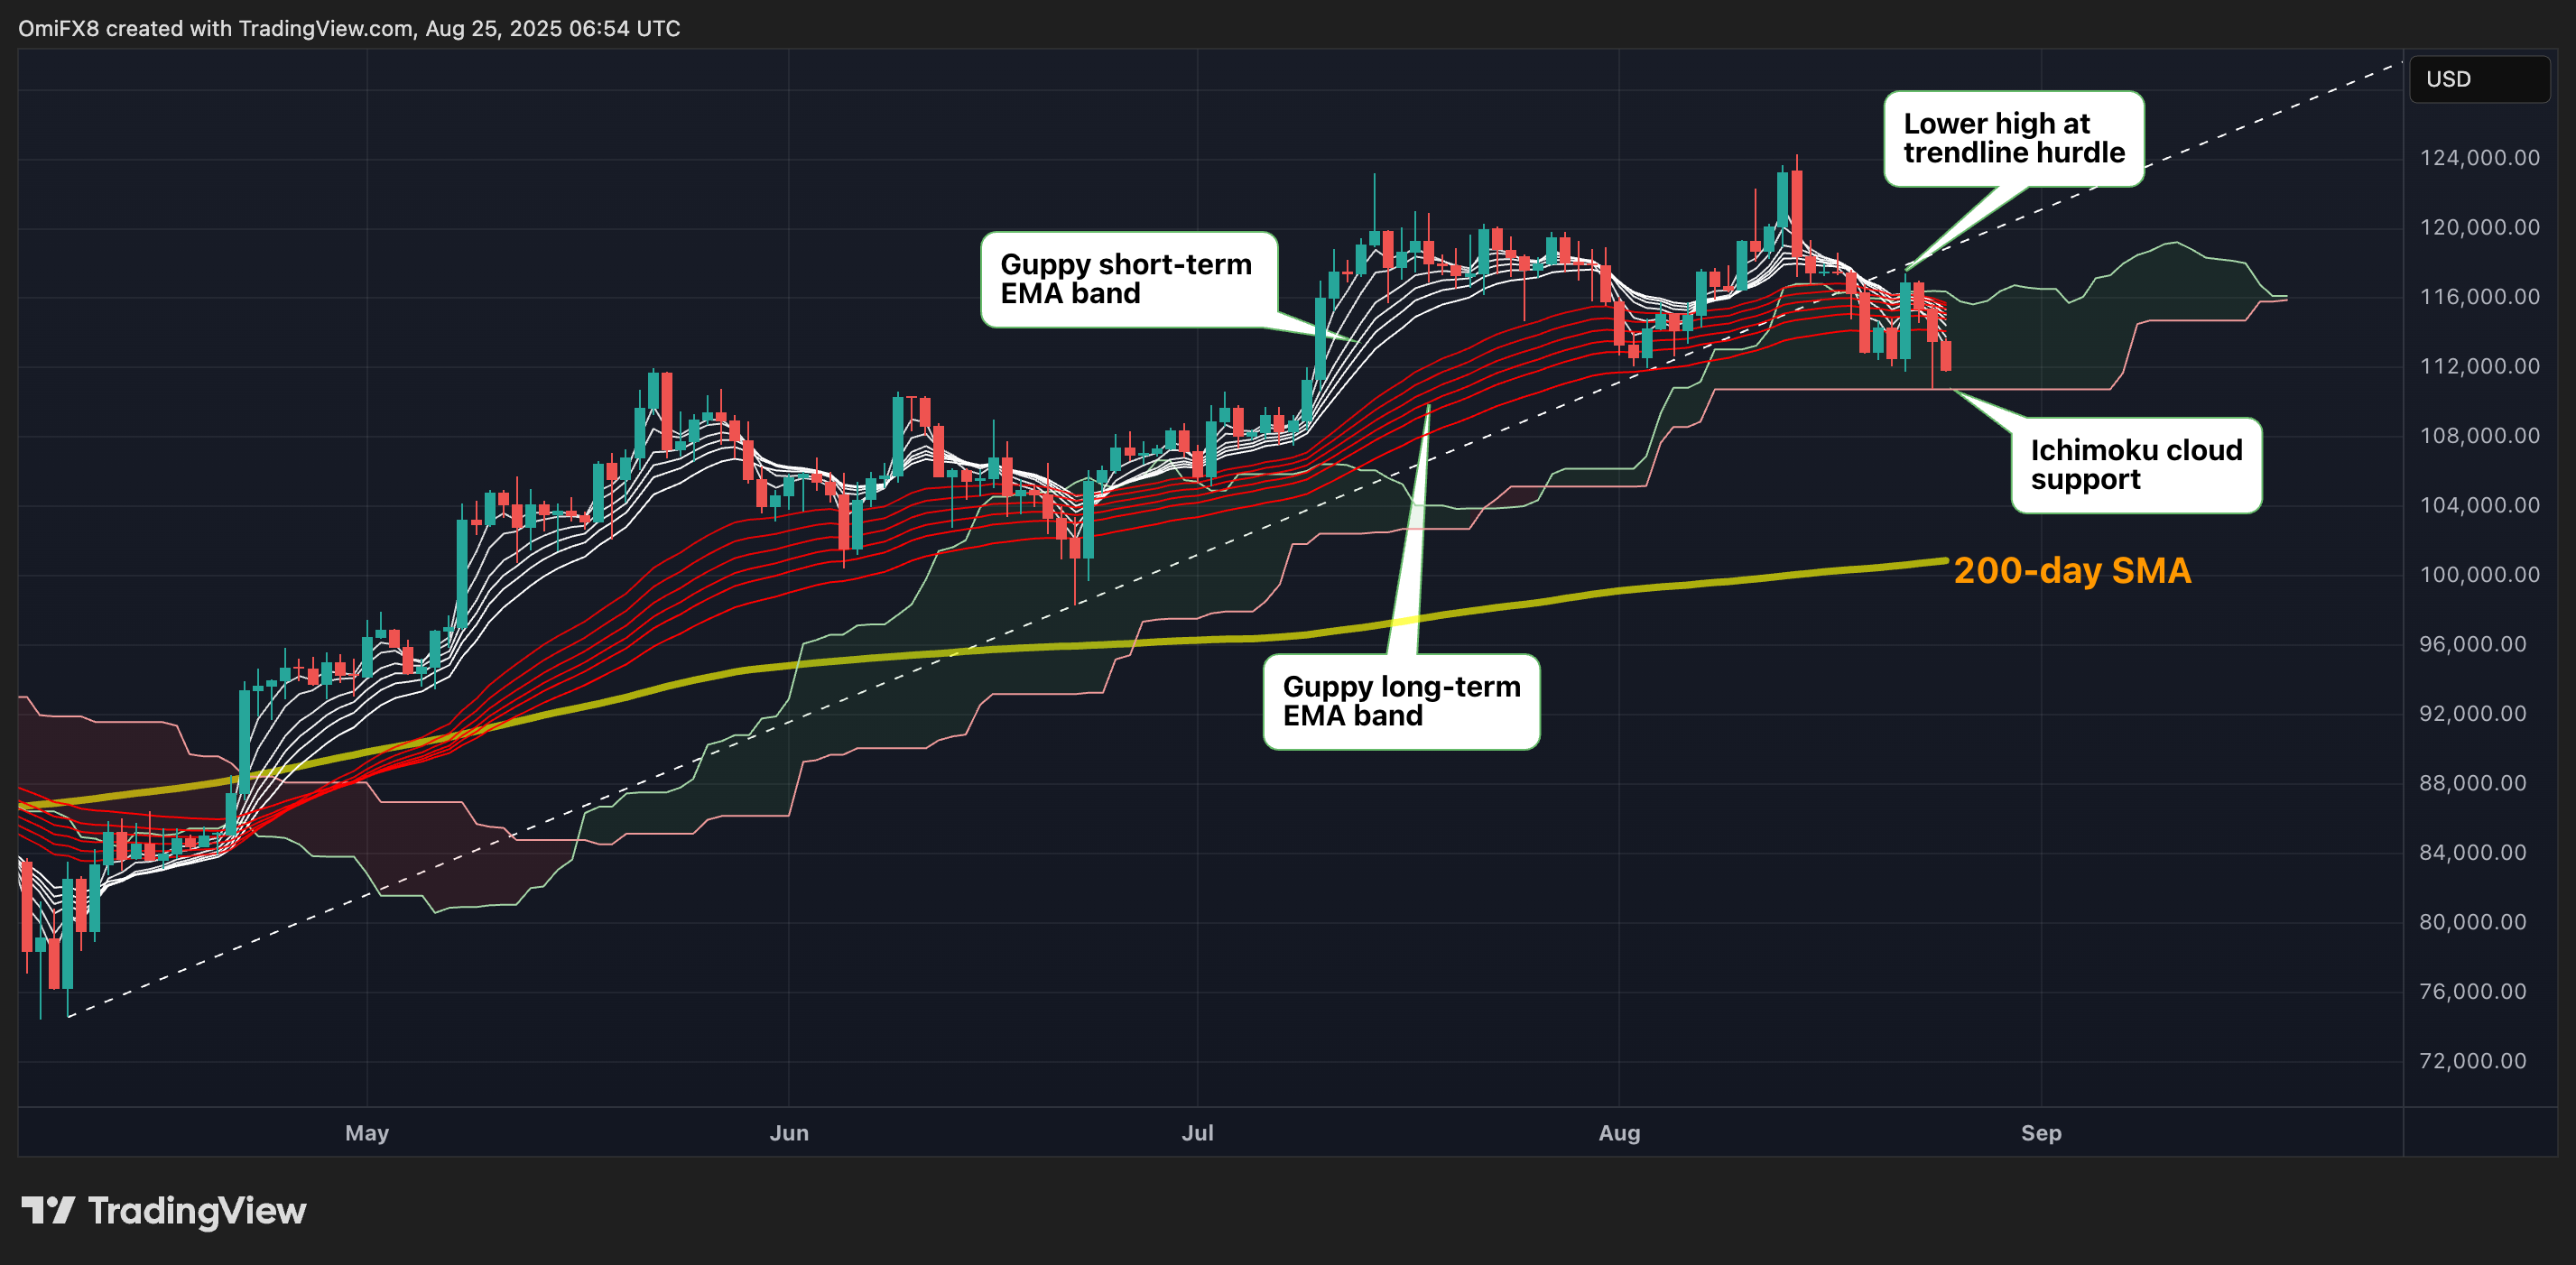
Currently, BTC is hovering just above $112,000 after surging to around $117,440 on Friday. A look at the daily chart reveals that this post-speech rally created a lower high — a bearish technical signal — near a trendline that’s been declining since April.
This pattern confirms that BTC broke below its former bullish trendline and is struggling to regain upward momentum. Lending further credibility to this bearish outlook, the Guppy Multiple Moving Average (GMMA) metric is nearing a bearish crossover, where short-term exponential moving averages sink beneath longer-term ones.
On the broader weekly time frame, the MACD histogram has started the week in negative territory. This development hints that downward momentum is gaining traction.

A technical chart of Bitcoin illustrates a lower price high and bearish crossover signals.
Considering these factors, it’s alarming that the crypto market couldn’t build on Powell’s optimistic outlook. Bearish technical indicators continue to dominate, suggesting that caution is warranted.
Important support levels include $110,756, which aligns with the base of the Ichimoku cloud, and a heavier support around $100,000 indicated by the 200-day simple moving average. On the upside, a decisive move past the $117,440 peak is necessary to revive bullish momentum.
- Support: $110,756, $100,887, $100,000
- Resistance: $117,440, $120,000, $122,056
Ether Hits Peak but Signals Exhaustion
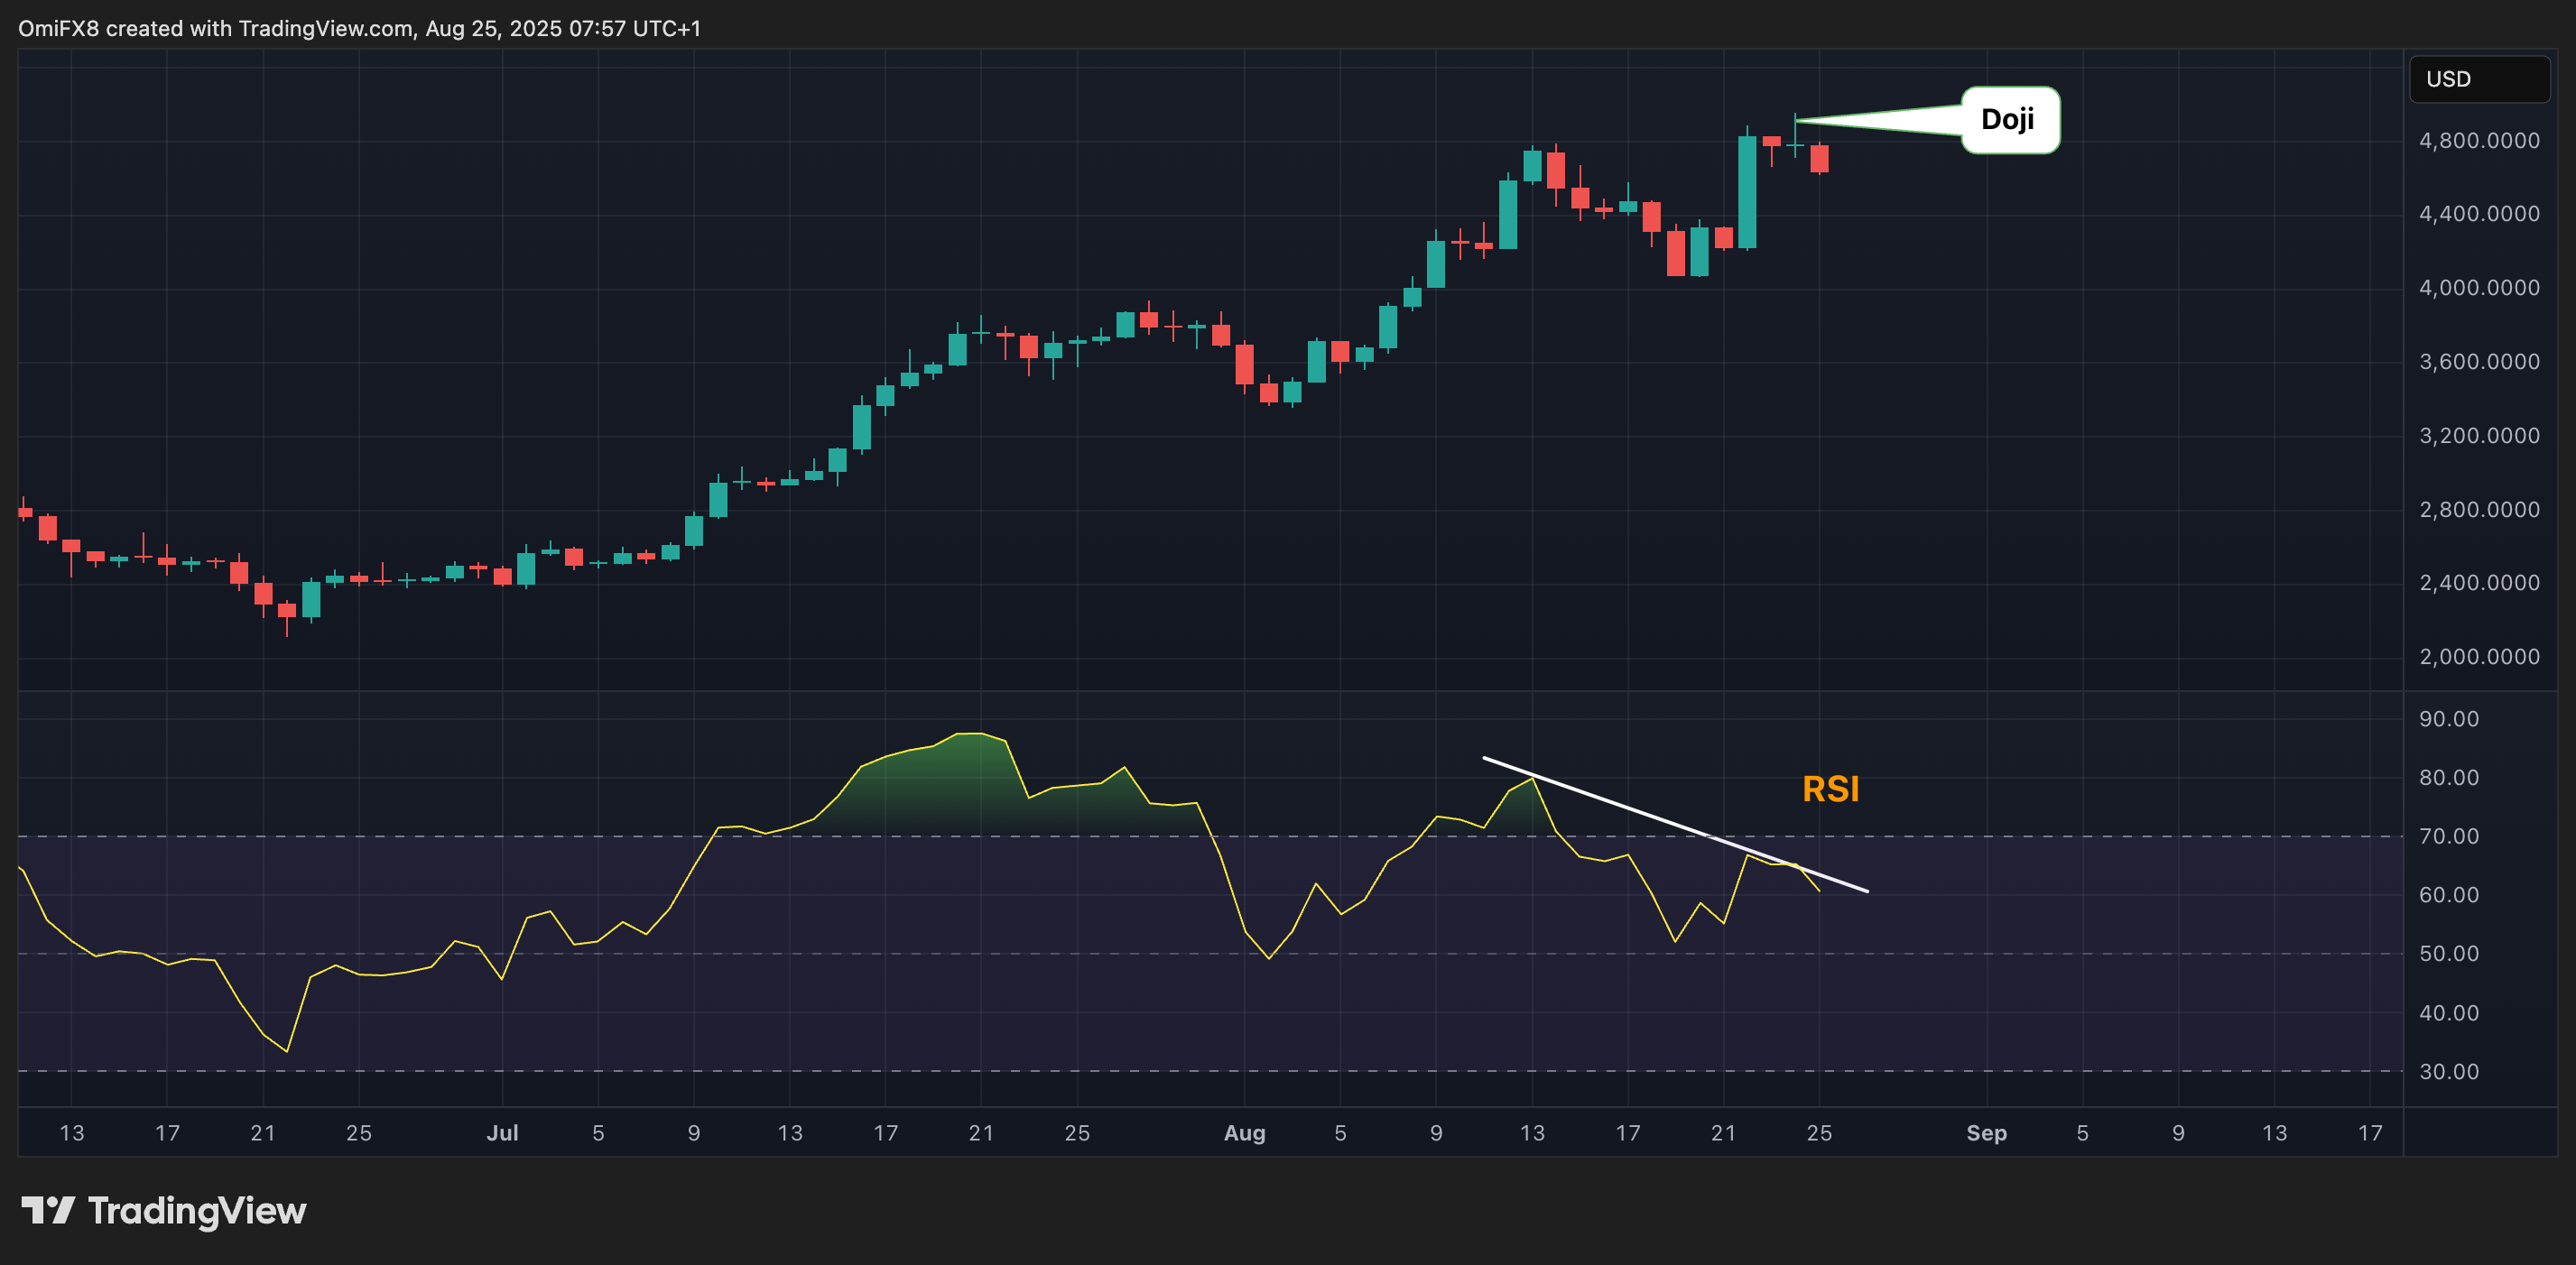
Ether (ETH), on the other hand, printed a doji on Sunday — a candlestick that often represents indecision in the market. This type of candle forms when the opening and closing prices are nearly identical, signaling that bulls and bears are at a stalemate.
What’s especially notable is the long upper wick of the candlestick, which signals that while buyers attempted to push ETH into new territory, sellers succeeded in dragging the price back down by the close. This suggests waning bullish sentiment despite record highs.
Doji patterns are not definitive signs of reversal, but they often precede periods of consolidation or pullbacks. In Ether’s case, the 14-day relative strength index (RSI) has been forming lower highs, even as the price reached new peaks — a classic bearish divergence that points to lost momentum.

Ether’s daily chart highlights a doji at record highs and declining RSI strength—signals of potential exhaustion.
ETH had dropped 3% on the day to trade around $4,624 at press time. Analysts are keeping an eye on the $4,065 level, a recent support from August 20, as a potential stabilizing point.
Related: XRP Price: $12M Max Pain for Bears
- Support: $4,065, $4,000, $3,805 (50-day SMA)
- Resistance: $5,000, record highs
For a deeper dive into Bitcoin’s response to Powell’s remarks and market sentiment around crypto options, check out this analysis: Bitcoin Reverses Powell Spike With a Flash Crash as Options Market Signals Jitters Ahead
Quick Summary
XRP is displaying surprising resilience amid a broader pullback in the cryptocurrency market, as Bitcoin and Ether both lose upward momentum following recent macroeconomic cues.
Source
Information sourced from official Ripple publications, institutional research, regulatory documentation and reputable crypto news outlets.
Author
Ripple Van Winkle is a cryptocurrency analyst and founder of XRP Right Now. He has been active in the crypto space for over 8 years and has generated more than 25 million views across YouTube covering XRP daily.
Editorial Note
Opinions are the author's alone and for informational purposes only. This publication does not provide investment advice.


