XRP shows signs of institutional accumulation at the $2.40 level. A descending triangle pattern indicates a potential breakout or breakdown. Broader market sentiment and ETF decisions could influence XRP’s next move.
What to Know:
- XRP shows signs of institutional accumulation at the $2.40 level.
- A descending triangle pattern indicates a potential breakout or breakdown.
- Broader market sentiment and ETF decisions could influence XRP’s next move.
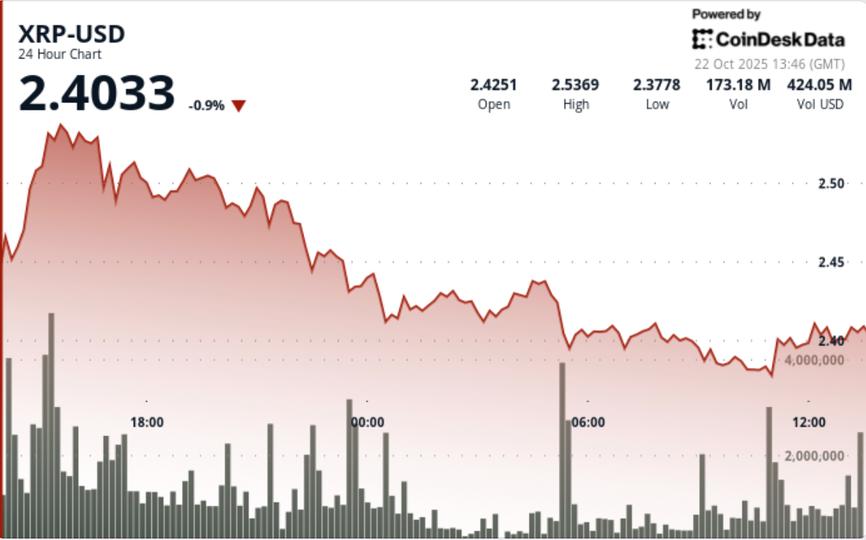
XRP is showing resilience as it consolidates, with increased trading volumes suggesting institutional interest despite underperforming the broader crypto rally. The digital asset gained 1.33% to $2.41, but this was less than the CD5 index, even with a nearly 10% spike in trading volume above the weekly average. This uptick in activity hints at strategic positioning by larger players around key technical levels, setting the stage for a potential breakout.
The observed pattern of failed rallies above $2.45, coupled with elevated volume below resistance, is characteristic of institutional accumulation strategies. XRP’s relative underperformance compared to Bitcoin may simply reflect sector rotation rather than any fundamental weakness. Ripple’s ongoing $1 billion fundraising efforts and multiple pending ETF applications continue to bolster long-term confidence in XRP.
Technically, XRP is forming a descending triangle between the $2.54 resistance and the $2.40 support, a pattern that suggests a period of tightening volatility. A decisive break below $2.40 could lead to a pullback towards $2.30, while a breakout above the $2.45–$2.54 range would negate the bearish setup and signal renewed bullish momentum. Elevated relative volume confirms that professional traders are actively shaping the price action.
Looking ahead, traders are closely watching whether institutional flows can maintain the increased volume threshold, particularly around the $2.40 support level. The key to XRP’s next move lies in breaking through the $2.54 resistance, which could trigger a significant rally. Macroeconomic factors, such as decisions on crypto ETFs and shifting risk sentiment influenced by gold’s decline, will also play a crucial role in determining XRP’s trajectory.
In conclusion, XRP’s current consolidation phase, marked by institutional accumulation and technical patterns, suggests a potential for significant movement. Investors should monitor volume trends and key price levels to gauge the direction of the next breakout, while keeping an eye on broader market developments and regulatory decisions.
Related: XRP Price: $12M Max Pain for Bears
Source: Original article
Quick Summary
XRP shows signs of institutional accumulation at the $2.40 level. A descending triangle pattern indicates a potential breakout or breakdown. Broader market sentiment and ETF decisions could influence XRP’s next move. XRP is showing resilience as it consolidates, with increased trading volumes suggesting institutional interest despite underperforming the broader crypto rally.
Source
Information sourced from official Ripple publications, institutional research, regulatory documentation and reputable crypto news outlets.
Author
Ripple Van Winkle is a cryptocurrency analyst and founder of XRP Right Now. He has been active in the crypto space for over 8 years and has generated more than 25 million views across YouTube covering XRP daily.
Editorial Note
Opinions are the author's alone and for informational purposes only. This publication does not provide investment advice.


