XRP is showing signs of a strong recovery, rebounding from the $2 mark, fueled by positive market sentiment and recent ETF inflows. Technical analysis suggests a potential rally toward the $3.30–$3.50 range, but key resistance levels must be overcome to confirm this bullish outlook.
What to Know:
- XRP is showing signs of a strong recovery, rebounding from the $2 mark, fueled by positive market sentiment and recent ETF inflows.
- Technical analysis suggests a potential rally toward the $3.30–$3.50 range, but key resistance levels must be overcome to confirm this bullish outlook.
- A failure to break through resistance could lead to a price correction, potentially testing support levels around $1.82, highlighting the inherent risks in the current market setup.
XRP is making waves, exhibiting a notable recovery from the critical $2 level. This resurgence is unfolding against a backdrop of increasing optimism in the broader digital asset market, bolstered by the launch of new XRP-based ETFs. For institutional investors and active traders, this presents both an opportunity and a challenge: can XRP sustain this momentum, or is this merely a temporary reprieve in a volatile market?
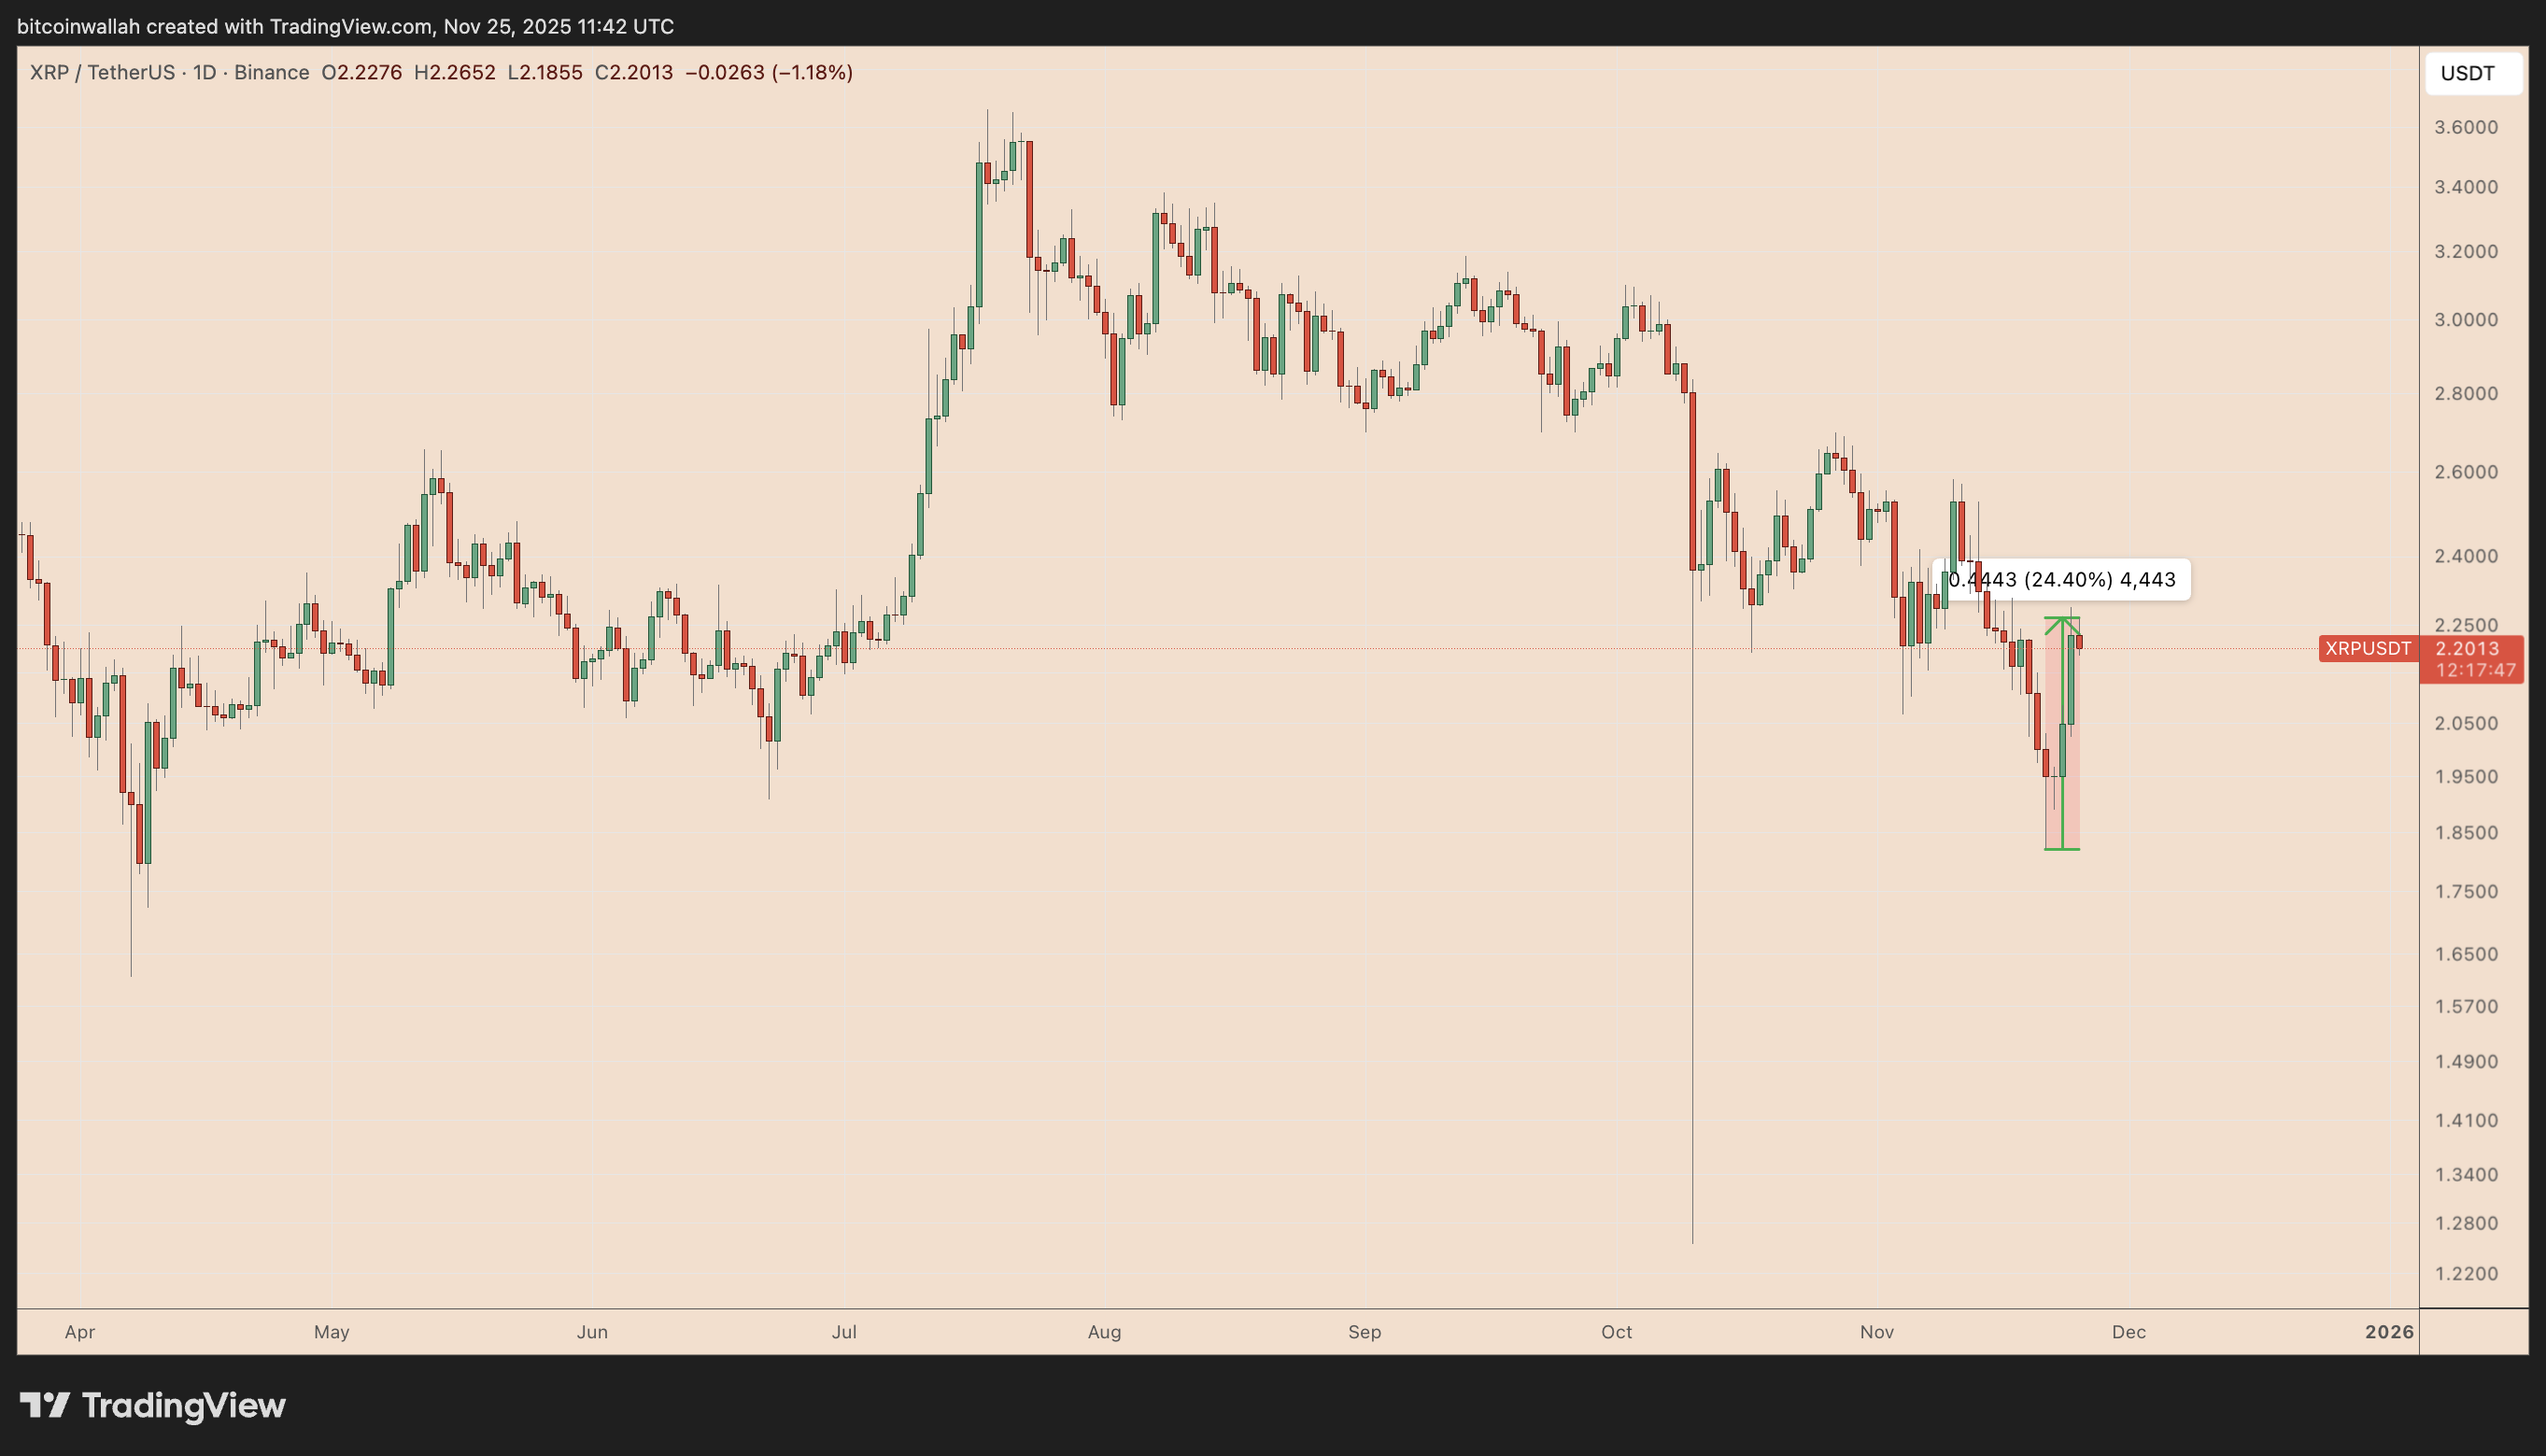
The past week has seen XRP rally nearly 25% from its recent low, driven in part by the tailwinds of substantial daily ETF inflows, exceeding $164 million. These inflows followed the introduction of Grayscale’s GXRP and Franklin Templeton’s XRPZ, marking a significant step in the institutionalization of XRP. The psychological impact of these ETF launches cannot be overstated, as they provide a regulated and accessible avenue for traditional investors to gain exposure to XRP. This is similar to what we observed with Bitcoin ETFs, which initially sparked a rally before market realities set in.

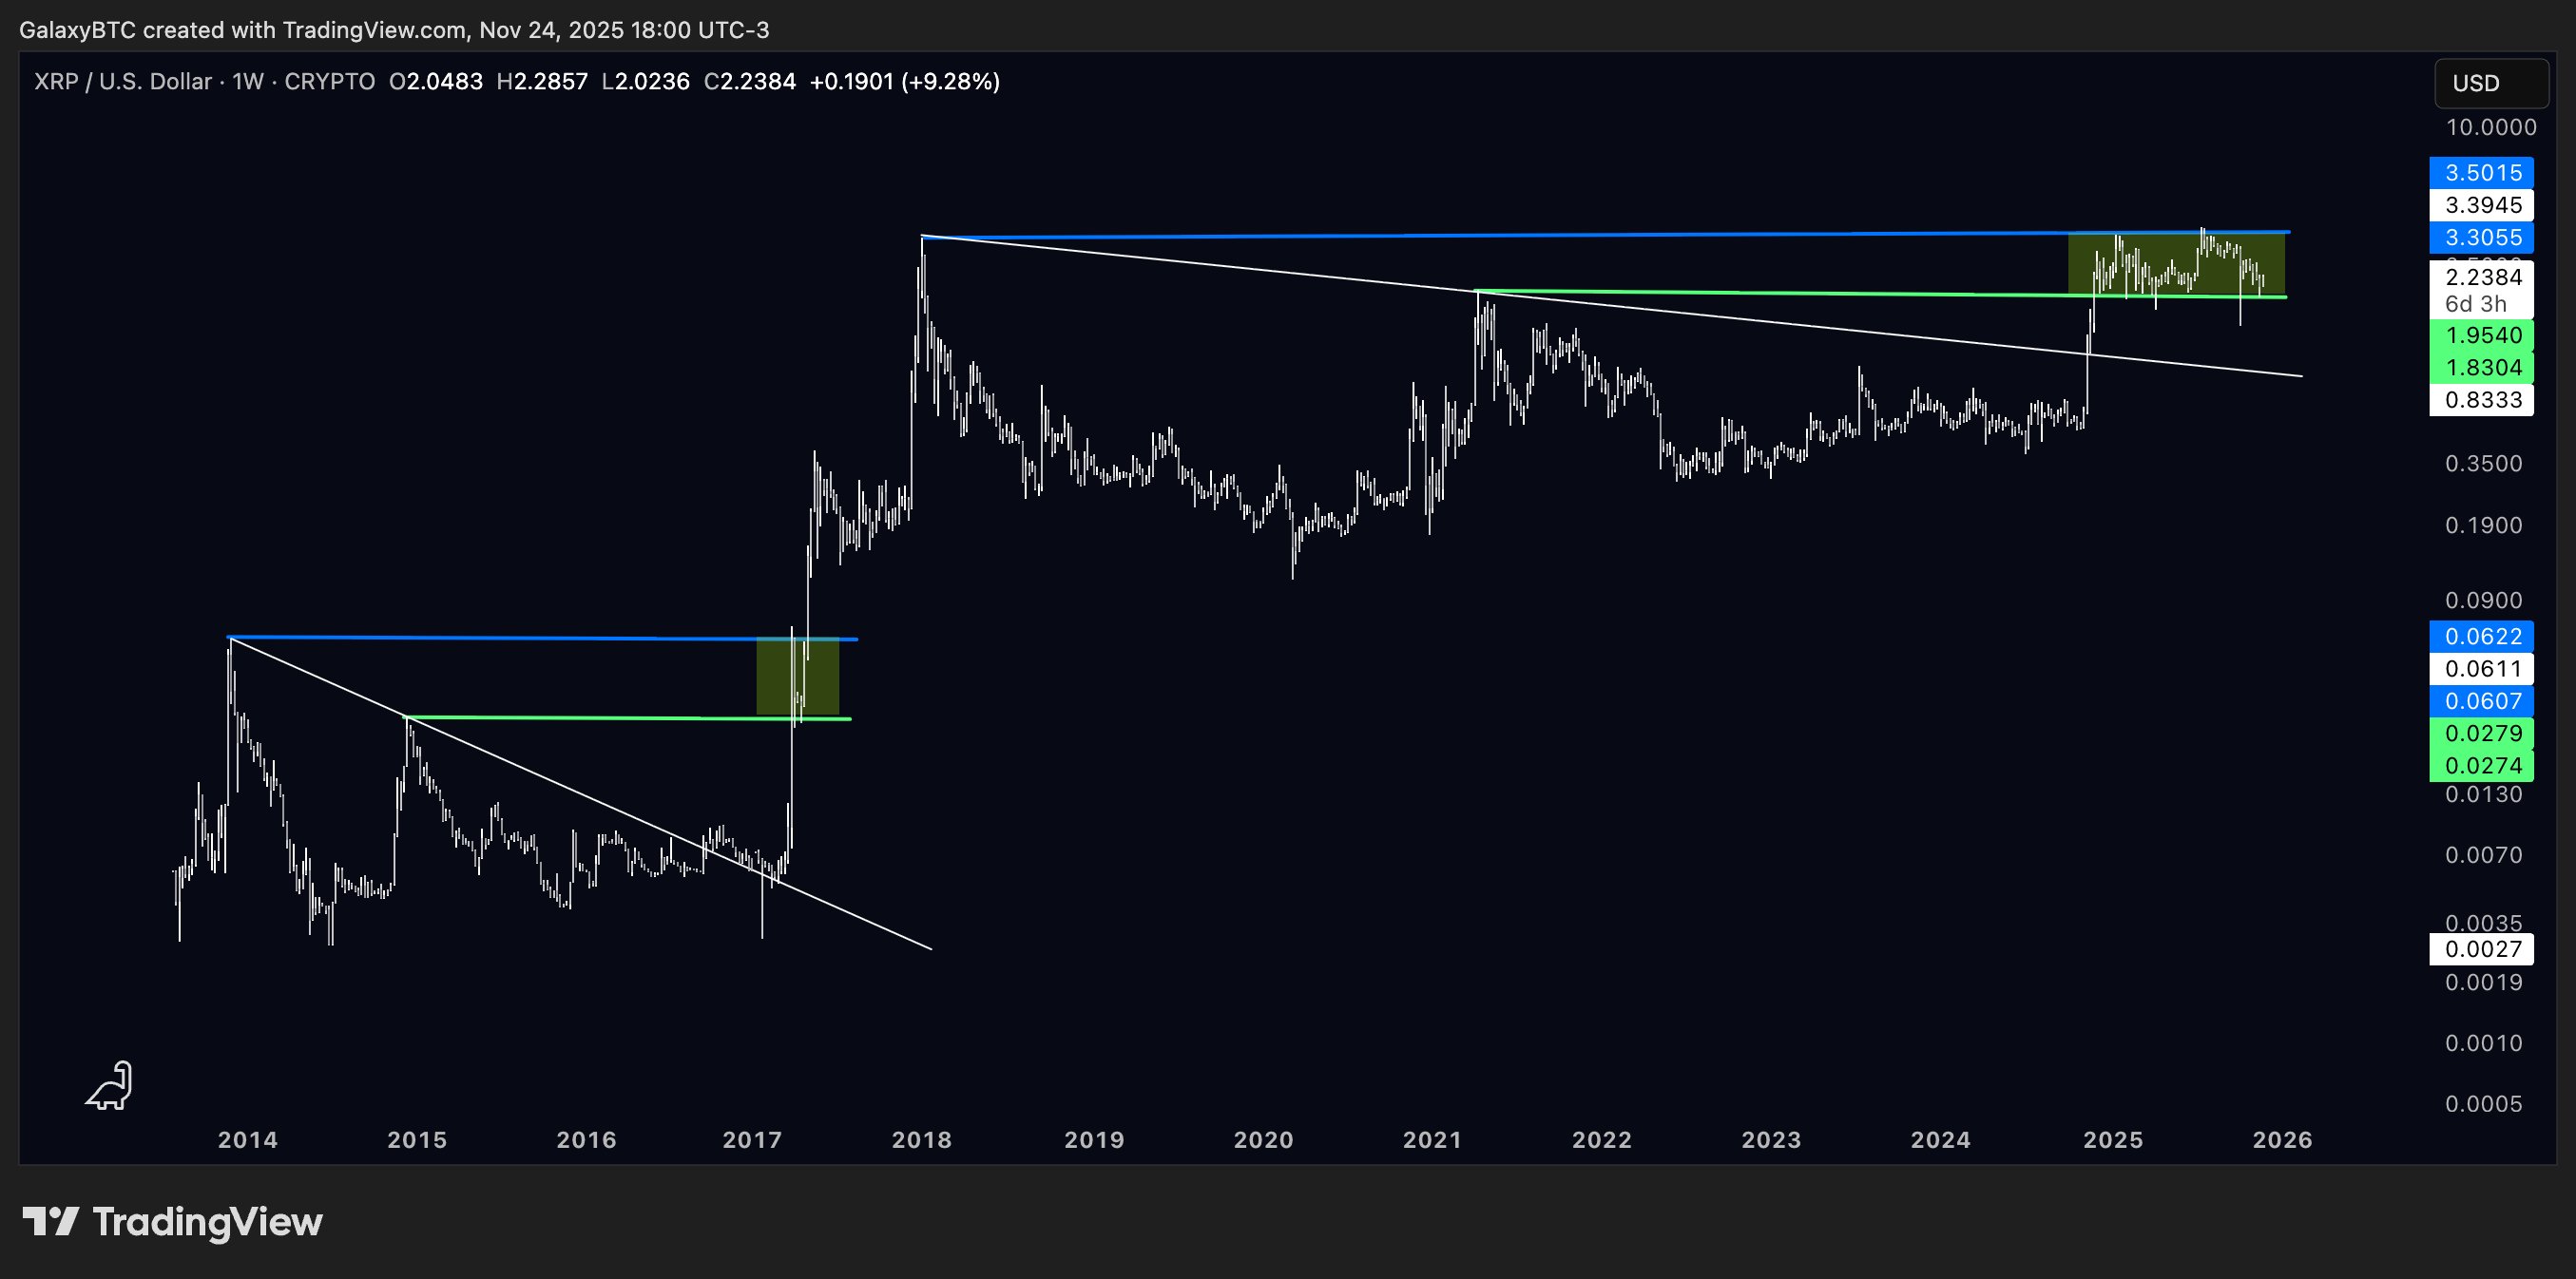
From a technical standpoint, XRP’s ability to defend the $1.95–$2.05 support band within its prevailing parallel channel is a bullish signal. This zone has historically acted as a reliable support level since December 2024, with previous retests leading to substantial bounces toward the channel’s upper boundary near $3.50. If this pattern holds, XRP could potentially gain another 50% by the end of the year. However, technical analysis is not a crystal ball, and these patterns can be disrupted by unforeseen market events or shifts in investor sentiment.
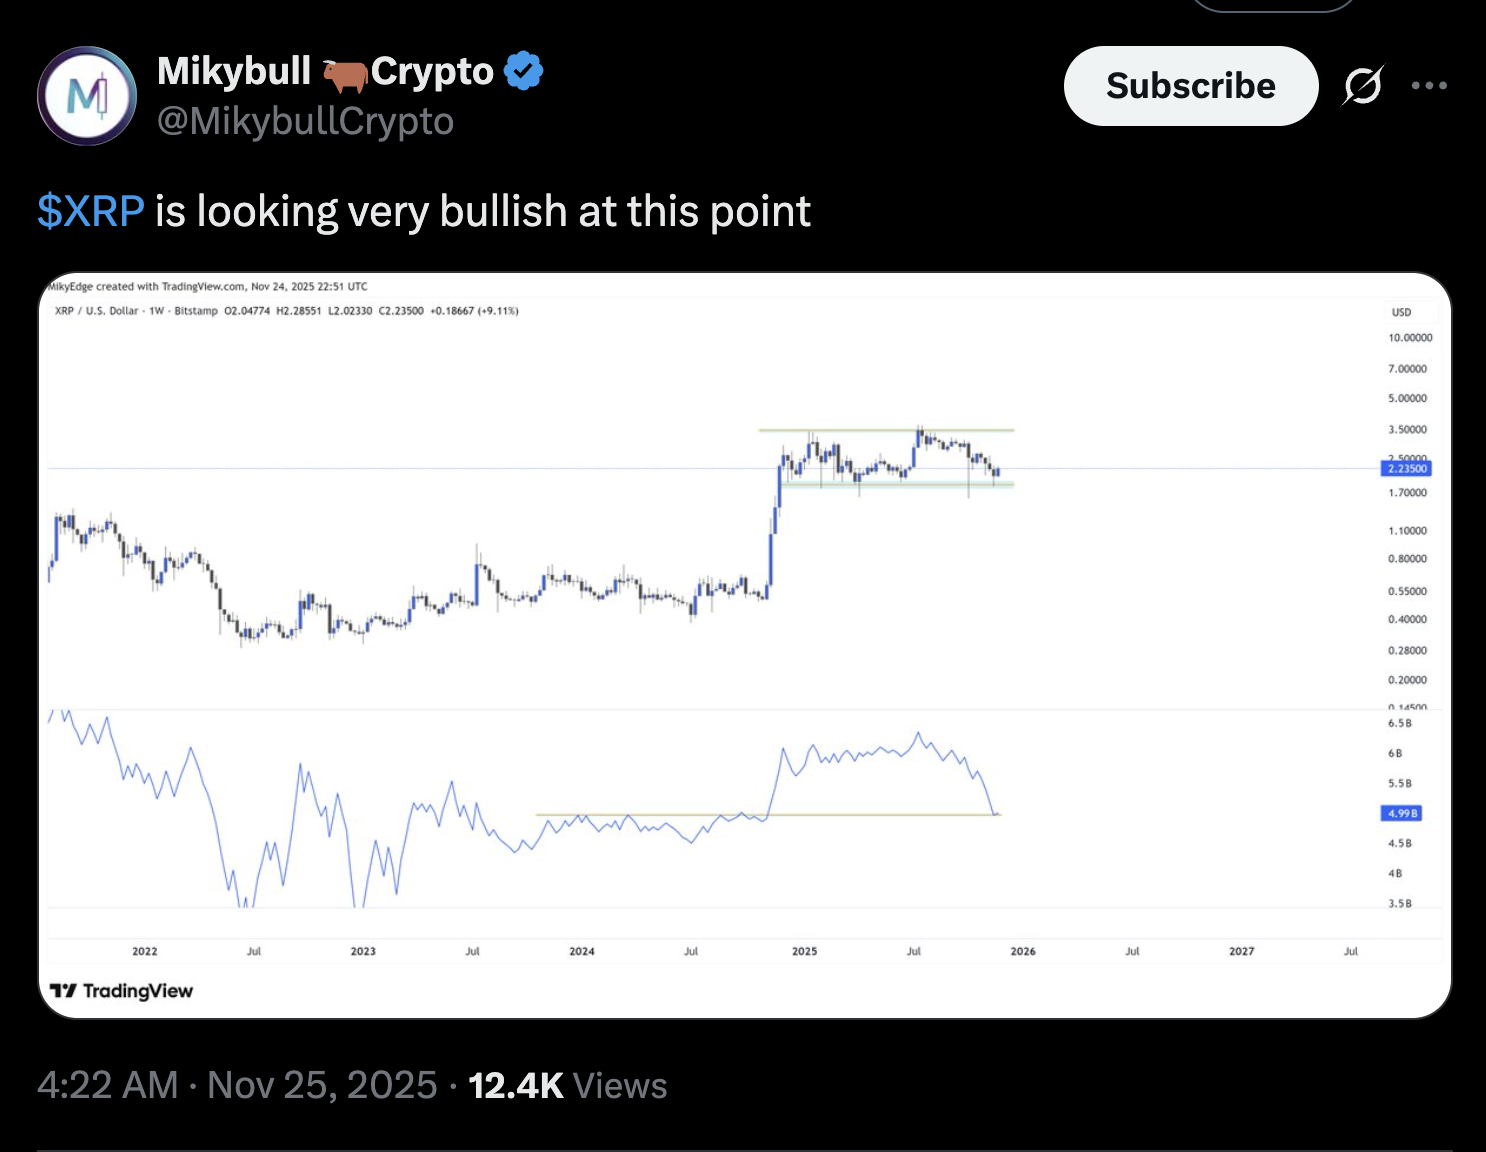
On-balance volume (OBV) analysis further supports the bullish case. The OBV indicator, which measures buying and selling pressure, has bounced from a major support area concurrent with the price touching $2. This suggests that genuine spot buyers are entering the market, rather than exiting, reinforcing the notion of a sustainable recovery. This is a crucial distinction, as it indicates underlying strength and conviction among investors, rather than speculative trading.

Some analysts are drawing parallels between XRP’s current market structure and its explosive breakout in 2017. The argument is that the $2 region is behaving similarly to the mid-range support XRP reclaimed before its historic rally eight years ago. With prices stabilizing around this level and buyers stepping back in, there is a potential for XRP to revisit the upper boundary near $3.30–$3.50. While historical patterns can provide valuable insights, it’s important to remember that past performance is not necessarily indicative of future results. The market landscape has changed significantly since 2017, with increased regulatory scrutiny and greater institutional participation.

Despite the bullish signals, XRP faces several technical hurdles. The token is currently testing the 0.236 Fibonacci retracement level near $2.23 as resistance. A decisive breakout above this level would then encounter further barriers, including the 50-day and 200-day EMAs, which have capped XRP’s upside attempts since early October. These EMAs sit almost exactly at the upper trendline of XRP’s descending channel, a pattern that has guided the price lower since the summer. If this pattern holds, XRP could rotate back to the channel’s lower boundary, potentially dropping toward the 0.0 Fib line near $1.82 by the end of the year.

In conclusion, XRP’s recent rebound is supported by a confluence of factors, including positive ETF inflows, supportive technical indicators, and historical patterns. However, the path ahead is not without its challenges. Key resistance levels must be overcome to confirm a sustained upside move, and a failure to do so could lead to a price correction. Institutional investors and active traders should carefully weigh these factors and conduct their own due diligence before making any investment decisions. The digital asset market remains inherently volatile, and risk management is paramount.
Related: XRP Price: $12M Max Pain for Bears
Source: Original article
Quick Summary
XRP is showing signs of a strong recovery, rebounding from the $2 mark, fueled by positive market sentiment and recent ETF inflows. Technical analysis suggests a potential rally toward the $3.30–$3.50 range, but key resistance levels must be overcome to confirm this bullish outlook.
Source
Information sourced from official Ripple publications, institutional research, regulatory documentation and reputable crypto news outlets.
Author
Ripple Van Winkle is a cryptocurrency analyst and founder of XRP Right Now. He has been active in the crypto space for over 8 years and has generated more than 25 million views across YouTube covering XRP daily.
Editorial Note
Opinions are the author's alone and for informational purposes only. This publication does not provide investment advice.


