XRP is showing signs of a strong recovery, bouncing off the $2 level with potential for significant upside. Recent ETF inflows and technical indicators suggest a possible rally toward the $3.30–$3.50 range. Key resistance levels and bearish scenarios could still temper bullish momentum, requiring careful monitoring.
What to Know:
- XRP is showing signs of a strong recovery, bouncing off the $2 level with potential for significant upside.
- Recent ETF inflows and technical indicators suggest a possible rally toward the $3.30–$3.50 range.
- Key resistance levels and bearish scenarios could still temper bullish momentum, requiring careful monitoring.
XRP is making waves again, showing resilience after rebounding from the critical $2 mark. This move is particularly noteworthy given the current macro environment where regulatory clarity, especially around assets like XRP, remains a key driver for institutional interest. The potential for XRP to reach the $3.30–$3.50 range isn’t just technical speculation; it’s tied to real-world factors like ETF inflows and broader market sentiment. For institutional and high-net-worth investors, these developments offer a compelling, albeit risky, opportunity.
Recent data highlights the strength behind XRP’s resurgence. The asset has jumped nearly 25% from the $2 level, fueled by substantial inflows into new XRP-backed ETFs. Grayscale’s GXRP and Franklin Templeton’s XRPZ have collectively seen over $164 million in daily inflows, signaling strong investor demand. This mirrors the early days of Bitcoin ETFs, where significant inflows often preceded notable price appreciation. However, it’s crucial to remember that ETF performance can be a double-edged sword; sustained inflows are necessary to maintain upward pressure.

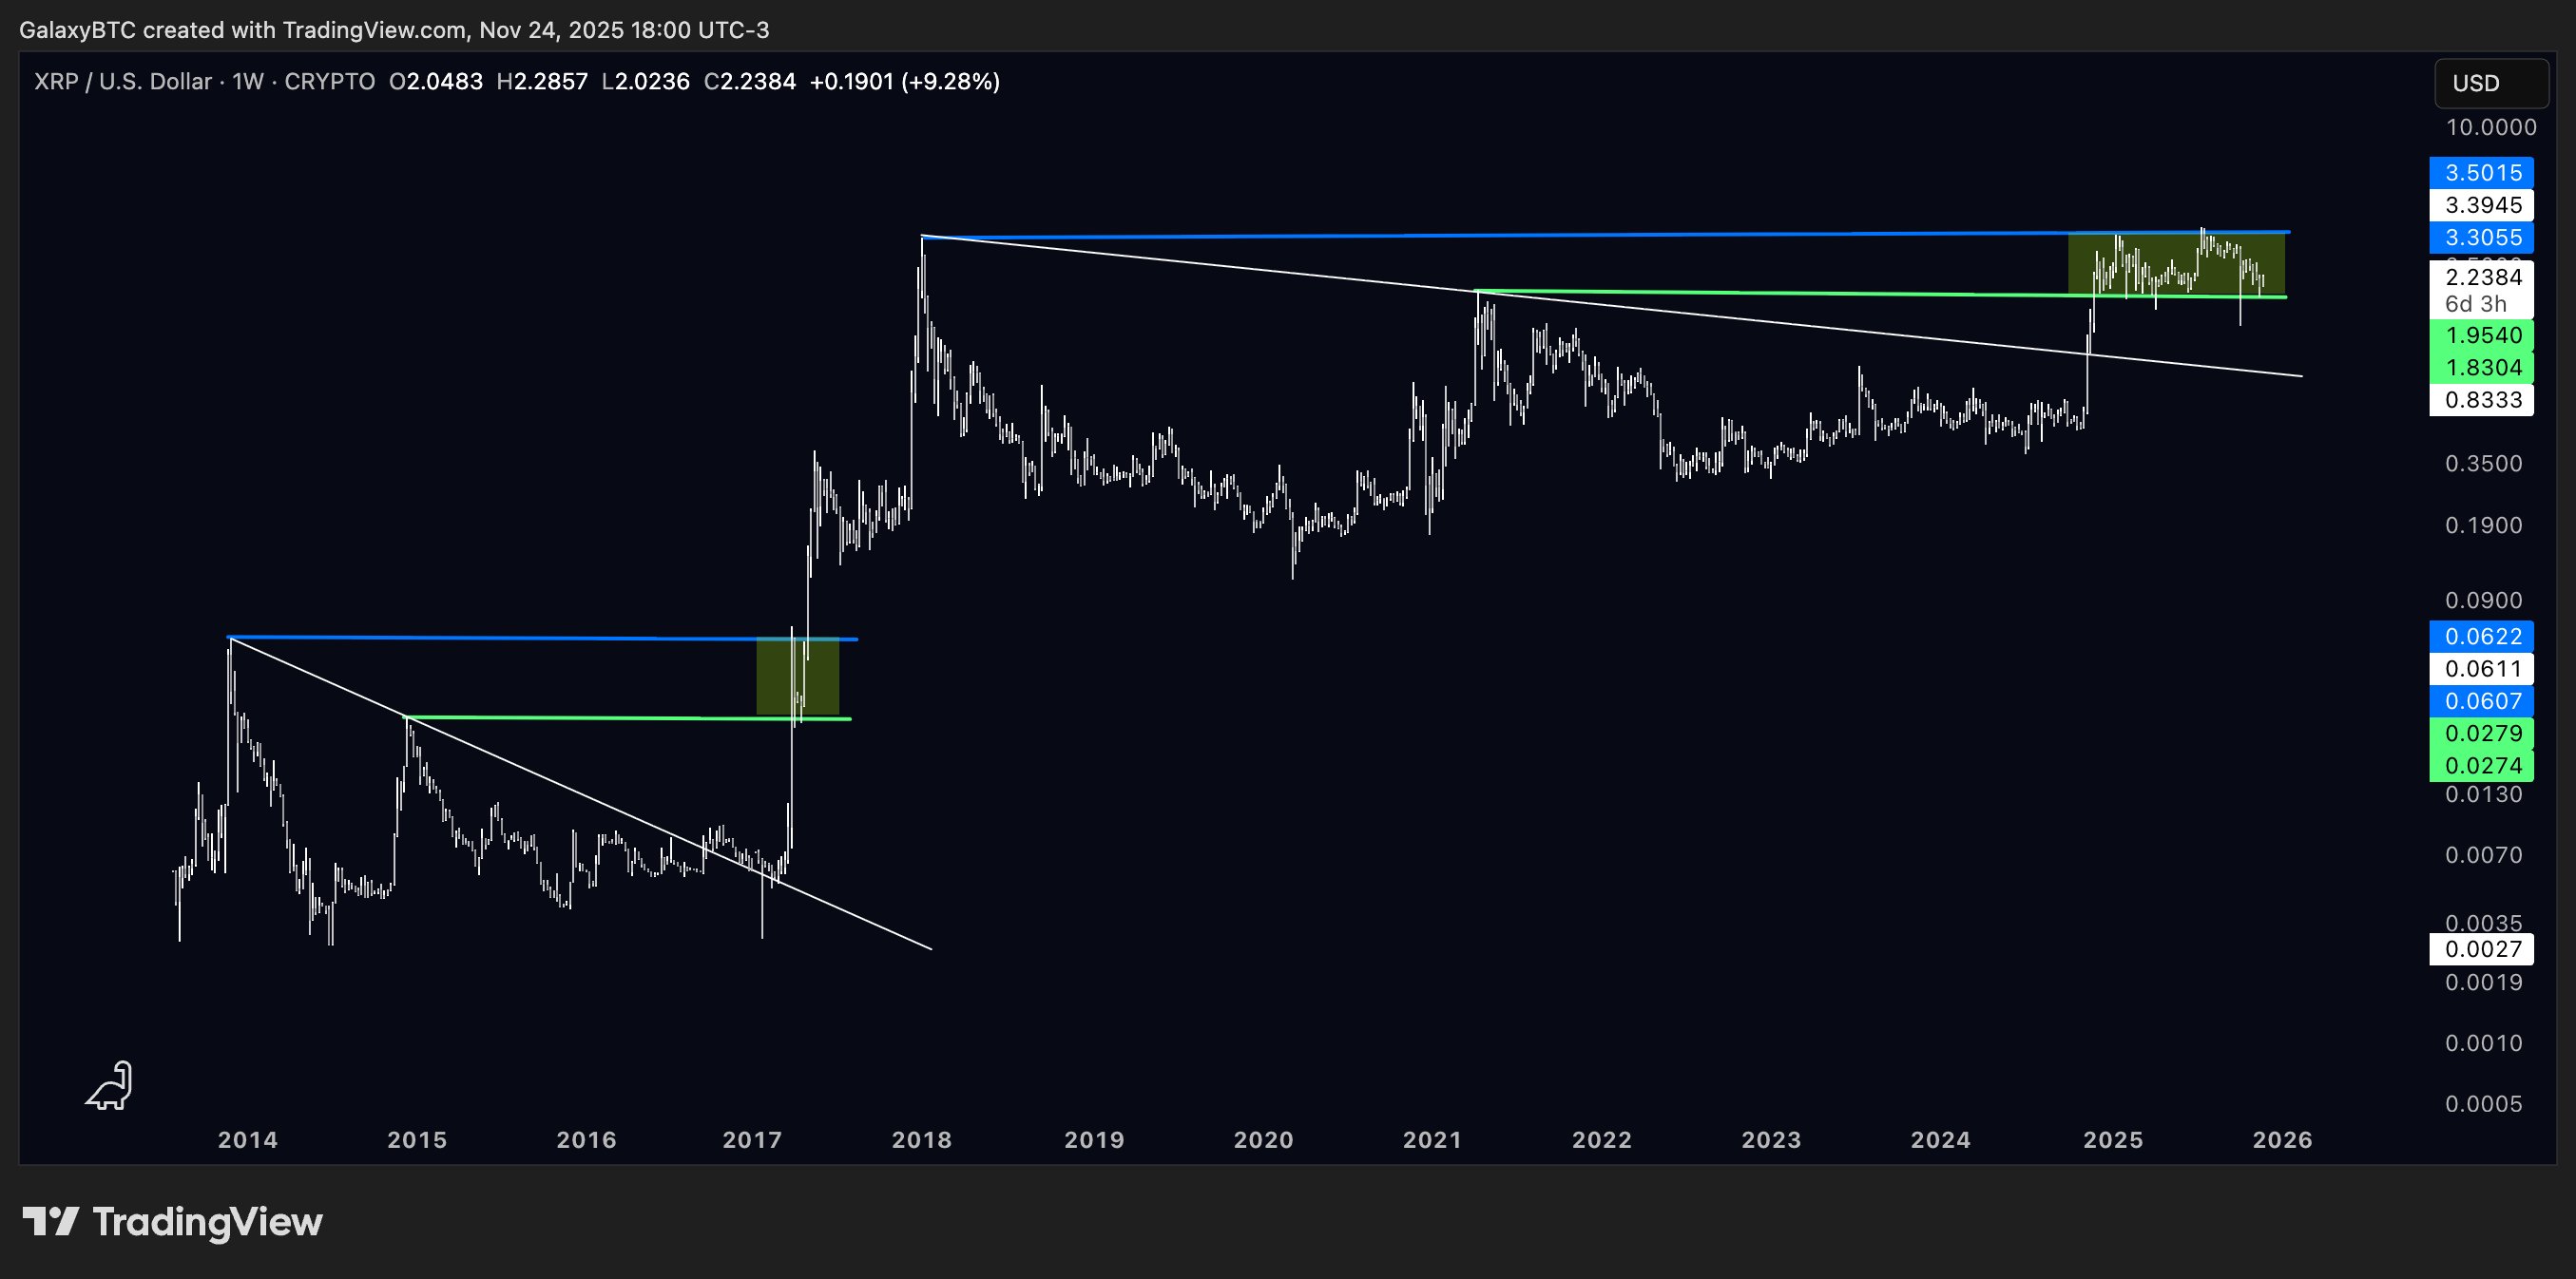
Technically, XRP’s chart presents a compelling case for further gains. The defense of the $1.95–$2.05 support band within a defined parallel channel is a bullish signal. Since December 2024, this zone has consistently acted as a springboard, with subsequent bounces leading to substantial gains toward the channel’s upper boundary near $3.50. If this pattern holds, we could see XRP appreciate by another 50% by the end of the year. This kind of technical consistency is what many institutional investors look for when evaluating potential entries.
On-balance volume (OBV) is another key indicator supporting the bullish outlook. OBV measures buying and selling pressure by tracking volume flow. The recent bounce in OBV from a major support area, coinciding with XRP’s price touching $2, suggests genuine buying interest. This is crucial because it indicates that spot buyers are actively accumulating XRP, rather than simply exiting positions. Such accumulation patterns often precede significant price movements, making OBV a valuable tool for gauging market sentiment.

Source: X
Source: X
Drawing parallels to XRP’s 2017 breakout, some analysts believe that the current market structure mirrors the setup that led to its explosive rally. The $2 region is behaving similarly to the mid-range support reclaimed before that historic surge. With XRP stabilizing around this level and buyers stepping back in, the potential for a revisit to the $3.30–$3.50 range seems increasingly likely. This fractal pattern, while not a guarantee, provides a historical context that many traders find valuable.

However, it’s not all clear skies for XRP. Several technical hurdles remain. The token is currently testing the 0.236 Fibonacci retracement level near $2.23 as resistance. A decisive breakout above this level is crucial, but it will then face further barriers: the 50-day and 200-day EMAs, which have historically capped XRP’s upside attempts. These EMAs align with the upper trendline of a descending channel, a pattern that has guided the price lower since the summer.

If this descending channel pattern persists, XRP’s price could rotate back to the channel’s lower boundary, potentially dropping toward the $1.82 level by year’s end. Such a move would invalidate the bullish setup and suggest the recent bounce was merely a temporary “dead cat bounce.” This bearish scenario underscores the importance of risk management and the need for investors to remain vigilant.
In conclusion, XRP’s recent rebound and positive technical indicators present a compelling case for potential upside, with targets in the $3.30–$3.50 range. The tailwinds from ETF inflows and supportive OBV data further strengthen this outlook. However, significant resistance levels and the potential for a continuation of the descending channel pattern necessitate caution. As always, investors should conduct thorough due diligence and consider their risk tolerance before making any investment decisions.
Related: XRP Price: $12M Max Pain for Bears
Source: Original article
Quick Summary
XRP is showing signs of a strong recovery, bouncing off the $2 level with potential for significant upside. Recent ETF inflows and technical indicators suggest a possible rally toward the $3.30–$3.50 range. Key resistance levels and bearish scenarios could still temper bullish momentum, requiring careful monitoring.
Source
Information sourced from official Ripple publications, institutional research, regulatory documentation and reputable crypto news outlets.
Author
Ripple Van Winkle is a cryptocurrency analyst and founder of XRP Right Now. He has been active in the crypto space for over 8 years and has generated more than 25 million views across YouTube covering XRP daily.
Editorial Note
Opinions are the author's alone and for informational purposes only. This publication does not provide investment advice.


